NAVADHI Market Research
Published on NAVADHI Market Research (https://www.navadhi.com)

Home > Uruguay Snapshot - PESTLE, SWOT, Risk and Macroeconomic Trends Analysis

Uruguay Snapshot - PESTLE, SWOT, Risk and Macroeconomic Trends Analysis

Uruguay Snapshot - PESTLE, SWOT, Risk and Macroeconomic Trends Analysis
Publication ID: 
NAV0323008
Publication Date: 
March 21, 2023
Pages: 
49
Countries: 
Uruguay [1]
Please choose the suitable license type from above. More details are at given under tab "Report License Types" below.

Uruguay Snapshot - PESTLE, SWOT, Risk and Macroeconomic Analysis report is designed to provide in-depth information about Uruguay including it’s PESTLE (political, economic, social, technological, legal and environmental), SWOT (Strengths, Weaknesses, Opportunities and Threats) and country risk analysis backed by macroeconomic data.

Uruguay stands out in Latin America for being an egalitarian society and for its high per capita income, low level of inequality and poverty and the almost complete absence of extreme poverty. In relative terms, its middle class is the largest in America, and represents 60% of its population. Uruguay occupies the top spots in the region in terms of various measures of well-being, such as the Human Development Index, the Human Opportunity Index and the Economic Freedom Index.

Uruguay Snapshot

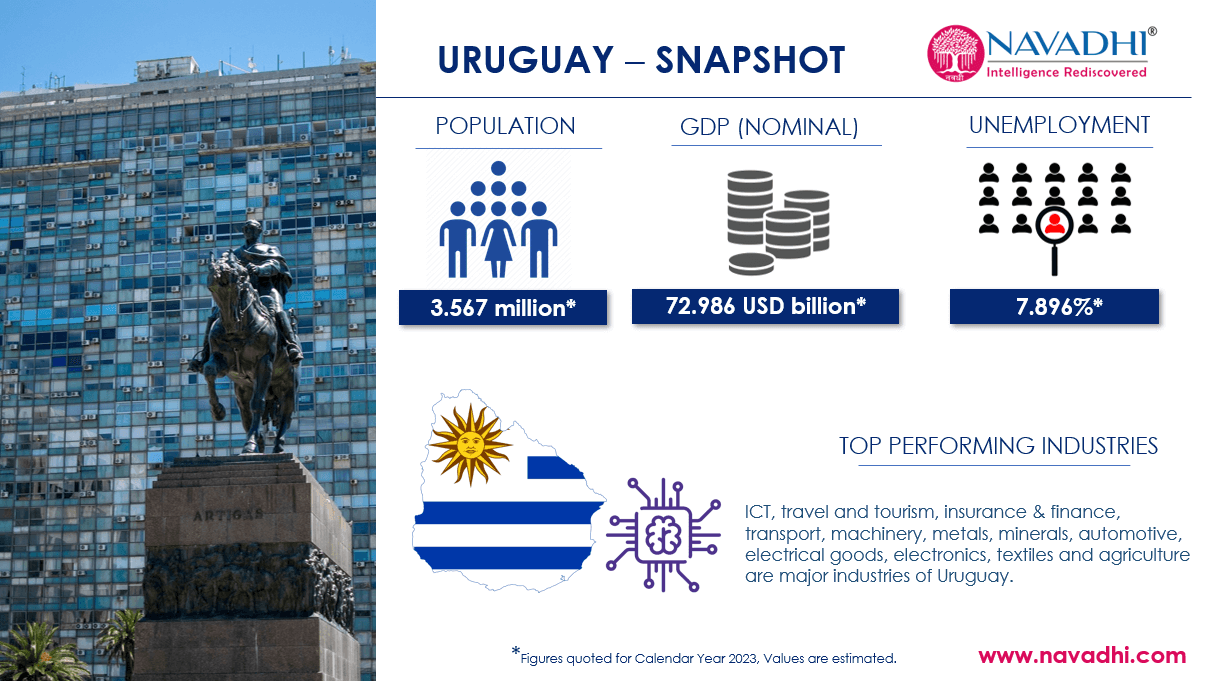
Uruguay is estimated to have population of 3.567 million in the year 2023 and expected to reach 3.611 million by 2027, increasing at a CAGR of 0.31%.

Uruguay’s real gross domestic product (GDP) was UYU 1660.894 billion in 2020 and while recovering from the COVID-19 impact it increased by 4.22% to be around UYU 1734.012 billion in 2021. It is further expected to increase by a CAGR of 3.06% and reach UYU 2078.321 billion by 2027.

Uruguay’s unemployment rate was 10.35% of total labor force in 2020. Despite slowdown in global economic activity due to COVID-19 pandemic, the unemployment in Uruguay decreased by 10.40% and reached 9.375% in 2021. Unemployment is further estimated to increase by a CAGR of 2.82% and reach 7.896% of total labor force in Uruguay by 2027.

Uruguay’s per capita GDP was USD 20,017.557 whereas purchasing power parity (PPP) based per capita GDP was USD 27,232.786 for the year 2022.

In 2022, Uruguay government’s revenue was UYU 807.529 billion whereas the expenditure was UYU 892.994 billion. This resulted in Uruguay government’s net lending / borrowing negative at UYU 85.465 billion in 2022 indicating that not enough financial resources were made available by the Uruguay government to boost economic growth.

The current account balance for Uruguay was negative USD 0.828 billion for the year 2022 and is expected to further decrease at a CAGR of 13.97% and reach negative USD 1.592 billion by 2027. This negative current account balance indicates that Uruguay will remain a net borrower from rest of the world till 2027.

Scope of Uruguay Snapshot – PESTLE, SWOT, Risk Macroeconomic Analysis Report

  • This report provides information about key macroeconomic indicators for Uruguay.
  • This report provides PESTLE (political, economic, social, technological, legal and environmental) analysis for Uruguay.
  • This report provides SWOT (Strengths, Weaknesses, Opportunities and Threats) analysis for Uruguay.
  • This report provides risk analysis for Uruguay.
  • This report provides information on Coronavirus (COVID-19) pandemic related policy response of Uruguay.
1. Executive Summary
Scope of Uruguay Snapshot – PESTLE, SWOT, Risk Macroeconomic Analysis Report
Research Methodology
2. PESTLE Analysis of Uruguay
2.1 Political Factors
2.2 Economic Factor
2.2.1 National Accounts Indicators
2.2.1.1 Real Gross Domestic Product
2.2.1.2 Nominal Gross Domestic Product
2.2.1.3 Gross Domestic Product Deflator
2.2.1.4 Per Capita Gross Domestic Product
2.2.1.5 Purchasing-Power-Parity (PPP) Based Per Capita GDP
2.2.1.6 Total Investment / Gross Capital Formation
2.2.1.7 Gross National Savings
2.2.2 Monetary Indicators
2.2.2.1 Consumer Price Index (CPI) Inflation
2.2.3 Trade Indicators
2.2.3.1 Change in Import Volume of Goods & Services
2.2.3.2 Change in Export Volume of Goods & Services
2.2.4 Government Finance Indicators
2.2.4.1 Government Revenue
2.2.4.2 Government Expenditure
2.2.4.3 Government Net Lending / Borrowing
2.2.4.4 Government Gross Debt
2.2.4.5 Government Net Debt
2.2.5 Balance of Payment Indicators
2.2.5.1 Current Account Balance
2.3 Social Factors
2.3.1 Population
2.3.2 Unemployment
2.4 Technological Factors
2.5 Legal Factors
2.6 Environmental Factors
3. SWOT Analysis of Uruguay
3.1 Strengths
3.2 Weaknesses
3.3 Opportunities
3.4 Threats
4. Risk Analysis of Uruguay
5. COVID-19 Related Policy Response of Uruguay
5.1 Coronavirus (COVID-19) Containment Measures of Uruguay
5.2 Coronavirus (COVID-19) Related Fiscal Policy Measures by Uruguay
5.3 Coronavirus (COVID-19) Related Monetary Policy Measures by Uruguay
5.4 Coronavirus (COVID-19) Related Policy Measures for MSMEs by Uruguay
List of Exhibits
Notes
Company Information

List of Exhibits

Exhibit 2.1 Real GDP of Uruguay (in UYU billion) 2020-2027
Exhibit 2.2 Nominal GDP of Uruguay (in UYU billion) 2020-2027
Exhibit 2.3 Nominal GDP of Uruguay (in USD billion) 2020-2027
Exhibit 2.4 GDP Deflator Index for Uruguay 2020-2027
Exhibit 2.5 Per Capita GDP of Uruguay (in USD) 2020-2027
Exhibit 2.6 PPP Per Capita GDP of Uruguay (in USD) 2020-2027
Exhibit 2.7 Total Investment of Uruguay (in %) 2020-2027
Exhibit 2.8 Gross National Savings of Uruguay (in %) 2020-2027
Exhibit 2.9 Consumer Price Index (CPI) Inflation of Uruguay 2020-2027
Exhibit 2.10 Change in Import Volume of Goods & Services of Uruguay (in %) 2020-2027
Exhibit 2.11 Change in Export Volume of Goods & Services of Uruguay (in %) 2020-2027
Exhibit 2.12 Government Revenue of Uruguay (in UYU billion) 2020-2027
Exhibit 2.13 Government Revenue of Uruguay (in % of GDP) 2020-2027
Exhibit 2.14 Government Expenditure of Uruguay (in UYU billion) 2020-2027
Exhibit 2.15 Government Expenditure of Uruguay (in % of GDP) 2020-2027
Exhibit 2.16 Government Net Lending / Borrowing of Uruguay (in UYU billion) 2020-2027
Exhibit 2.17 Government Net Lending / Borrowing of Uruguay (in % of GDP) 2020-2027
Exhibit 2.18 Government Gross Debt of Uruguay (in UYU billion) 2020-2027
Exhibit 2.19 Government Gross Debt of Uruguay (in % of GDP) 2020-2027
Exhibit 2.20 Government Net Debt of Uruguay (in UYU billion) 2020-2027
Exhibit 2.21 Government Net Debt of Uruguay (in % of GDP) 2020-2027
Exhibit 2.22 Current Account Balance of Uruguay (in USD billion) 2020-2027
Exhibit 2.23 Current Account Balance of Uruguay (in % of GDP) 2020-2027
Exhibit 2.24 Uruguay – Top 10 Export Countries (in USD billion) & % Share in 2022
Exhibit 2.25 Uruguay – Top 10 Import Countries (in USD billion) & % Share in 2022
Exhibit 2.26 Population of Uruguay (in million) 2020-2027
Exhibit 2.27 Unemployment Level in Uruguay (in %) 2020-2027
Exhibit 3.1 SWOT Analysis of Uruguay
Exhibit 5.1 Covid-19 Policy Response for Supporting MSMEs by Uruguay

Single User License (PDF)

  • This license allows for use of a publication by one person.
  • This person may print out a single copy of the publication.
  • This person can include information given in the publication in presentations and internal reports by providing full copyright credit to the publisher.
  • This person cannot share the publication (or any information contained therein) with any other person or persons.
  • Unless a Enterprise License is purchased, a Single User License must be purchased for every person that wishes to use the publication within the same organization.
  • Customers who infringe these license terms are liable for a Enterprise license fee.


Site License (PDF)*

  • This license allows for use of a publication by all users within one corporate location, e.g. a regional office.
  • These users may print out a single copy of the publication.
  • These users can include information given in the publication in presentations and internal reports by providing full copyright credit to the publisher.
  • These users cannot share the publication (or any information contained therein) with any other person or persons outside the corporate location for which the publication is purchased.
  • Unless a Enterprise License is purchased, a Site User License must be purchased for every corporate location by an organization that wishes to use the publication within the same organization.
  • Customers who infringe these license terms are liable for a Enterprise license fee.


Enterprise License (PDF)*

  • This license allows for use of a publication by unlimited users within the purchasing organization e.g. all employees of a single company.
  • Each of these people may use the publication on any computer, and may print out the report, but may not share the publication (or any information contained therein) with any other person or persons outside of the organization.
  • These employees of purchasing organization can include information given in the publication in presentations and internal reports by providing full copyright credit to the publisher.

*If Applicable.

About Us

NAVADHI is a market research company that helps global firms differentiate themselves, break market entry barriers, track their investments, develop business strategies and plan for future by providing actionable market research intelligence that helps them succeed.

Infomation

  • About Us
  • Publications
  • FAQs
  • Privacy Policy
  • Terms & Conditions
  • Careers
  • Press Releases
  • Contact

Source URL:https://www.navadhi.com/publications/uruguay-snapshot-pestle-swot-risk-and-macroeconomic-trends-analysis

Links
[1] https://www.navadhi.com/countries/uruguay