
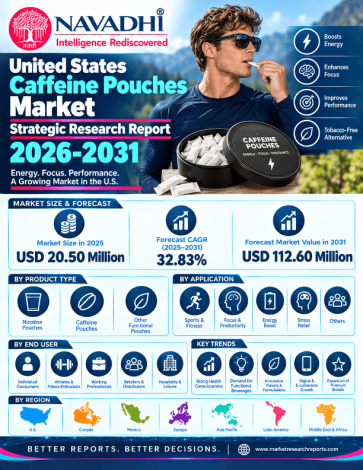

The United States caffeine pouches market is estimated at USD 20.5 million in 2025 and is projected to reach USD 112.6 million by 2031, a compound annual growth rate (CAGR) of 32.8% over 2026-2031. Volume is estimated at 3.4 million cans in 2025 (each can typically holds fifteen pouches), rising to 19.7 million cans by 2031. The 2031 bear and bull cases are USD 76.8 million and USD 160.8 million, reflecting the absence of audited scanner data, the short commercial history of the category and potential regulatory change. The base year blends a bottom-up channel build with a top-down brand-level median, weighted equally.
Caffeine pouches are discrete, orally administered pouches with caffeine as the primary active ingredient, formulated without nicotine, tobacco or added sugar, and sold as dietary supplements or conventional food items under the existing federal framework.
Scope of the United States Caffeine Pouches Market Strategic Research Report
This report covers market value (USD million) and volume (million cans) for 2022-2031, with 2025 as the base year and 2026-2031 as the forecast period. It analyses caffeine-strength and sales-channel segments, the four US Census Bureau regions, state-level markets, nine profiled brands, competitive structure, Porter's Five Forces, PESTLE, SWOT and future trends. Brand-level and state-level figures are estimates built from disclosed distribution data and labelled as such in the report.
Segment by Type
Segment by Application
Who Can Use This Report?
| 1. Executive Summary 1.1 United States Caffeine Pouches Market Strategic Research Report 2026–2031 1.2 Market Definition and Scope 1.3 Market Size, Forecast, and Scenario Analysis 1.4 Key Market Size Summary 1.5 Principal Growth Drivers 1.6 Segmentation Highlights 1.7 Competitive Structure 1.8 Principal Risks and Restraints 1.9 Outlook 2. Industry Overview & Forecast 2.1 Market Definition and Scope 2.2 Market Size and Historical Performance 2.3 Forecast and Growth Logic 2.4 Volume Analysis 2.5 Value Chain and Pricing Dynamics 3. Market Segmentation by Type 3.1 Overview of the Type Segmentation Framework 3.2 Low Strength (up to 50 mg) 3.2.1 Definition and Product Positioning 3.2.2 Market Size and Share 3.2.3 Growth Rate and Forecast 3.2.4 Demand Drivers 3.2.5 Technology, Pricing, and Risk 3.3 Medium Strength (51–100 mg) 3.3.1 Definition and Product Positioning 3.3.2 Market Size and Share 3.3.3 Growth Rate and Forecast 3.3.4 Demand Drivers 3.3.5 Technology, Pricing, and Risk 3.4 High Strength (above 100 mg) 3.4.1 Definition and Product Positioning 3.4.2 Market Size and Share 3.4.3 Growth Rate and Forecast 3.4.4 Demand Drivers 3.4.5 Technology, Pricing, and Risk 3.5 Volume Analysis 3.5.1 Volume Data by Year 3.5.2 Volume Trend Narrative 3.6 Comparative Mix-Shift Analysis 4. Market Segmentation by Application 4.1 Overview and Structural Context 4.1.1 Convenience Stores 4.1.2 Online Retail 4.1.3 Other Offline Retail 4.2 Comparative Channel Assessment 5. Regional Market Forecast (Census Regions) 5.1 Regional Market Forecast: United States Census Regions 5.1.1 Census Region Overview 5.1.2 South 5.1.2.1 Regional Position and Growth Outlook 2026–2031 5.1.2.2 Regulatory Context 5.1.3 West 5.1.3.1 Regional Position and Growth Outlook 2026–2031 5.1.3.2 Regulatory Context 5.1.4 Midwest 5.1.4.1 Regional Position and Growth Outlook 2026–2031 5.1.4.2 Regulatory Context 5.1.5 Northeast 5.1.5.1 Regional Position and Growth Outlook 2026–2031 5.1.5.2 Regulatory Context 5.1.6 Census Region Summary and Competitive Implications 6. State-Level Market Forecast (United States) 6.1 State-Level Market Forecast 6.1.1 National State Market Overview 6.1.1.1 Allocation Methodology 6.1.2 California 6.1.2.1 2025–2031 Market Snapshot 6.1.2.2 Store Count and Population Context 6.1.2.3 Growth Outlook 2026–2031 6.1.3 Texas 6.1.3.1 2025–2031 Market Snapshot 6.1.3.2 Store Count and Population Context 6.1.3.3 Growth Outlook 2026–2031 6.1.4 Florida 6.1.4.1 2025–2031 Market Snapshot 6.1.4.2 Store Count and Population Context 6.1.4.3 Growth Outlook 2026–2031 6.1.5 New York 6.1.5.1 2025–2031 Market Snapshot 6.1.5.2 Store Count and Population Context 6.1.5.3 Growth Outlook 2026–2031 6.1.6 Georgia, Ohio, North Carolina, Michigan, Pennsylvania, and Illinois 6.1.7 Rest of United States 6.1.8 State-Level Summary and Competitive Implications 6.1.8.1 Texas Versus California in 2031 6.1.8.2 Federal Regulatory Baseline 6.1.8.3 Where Convenience-Store Distribution Generates the Greatest Modelled Gain 7. Growth Drivers & Inhibitors 7.1 Overview 7.2 Growth Drivers 7.2.1 Accelerating Consumer Shift Away from High-Liquid Energy Formats 7.2.2 Rapid Expansion of Convenience and Fuel Channel Distribution 7.2.3 Flavor, Strength, and Formulation Innovation Expanding the Consumer Addressable Market 7.2.4 Social Commerce and Influencer-Driven Category Awareness Building 7.2.5 South Region Population Density, Convenience Infrastructure, and Demographic Alignment 7.2.6 Addressability of the Nicotine-Pouch Consumer Migration Pathway 7.3 Restraints 7.3.1 Absence of Federal Category-Specific Regulation Creates Prospective Uncertainty 7.3.2 Low Category Awareness and Consumer Confusion with Nicotine Pouches 7.3.3 Shallow Retail Shelf Penetration and Limited Category-Set Maturity 7.3.4 Data Scarcity and Market-Sizing Uncertainty Suppress Institutional Investment and Media Coverage 7.4 Impact Assessment 7.5 Integrated Assessment 8. Key Company Profiles 8.1 Wip 8.1.1 Company Overview 8.1.2 Key Products & Segments 8.1.3 Financial Performance (2023–2025) 8.1.4 Business Strategy 8.1.5 SWOT Analysis 8.1.6 Strategic Implications (2025–2031) 8.2 Grinds 8.2.1 Company Overview 8.2.2 Key Products & Segments 8.2.3 Financial Performance (2023–2025) 8.2.4 Business Strategy 8.2.5 SWOT Analysis 8.2.6 Strategic Implications (2025–2031) 8.3 Nectr 8.3.1 Company Overview 8.3.2 Key Products & Segments 8.3.3 Financial Performance (2023–2025) 8.3.4 Business Strategy 8.3.5 SWOT Analysis 8.3.6 Strategic Implications (2025–2031) 8.4 Roon 8.4.1 Company Overview 8.4.2 Key Products & Segments 8.4.3 Financial Performance (2023–2025) 8.4.4 Business Strategy 8.4.5 SWOT Analysis 8.4.6 Strategic Implications (2025–2031) 8.5 NZE 8.5.1 Company Overview 8.5.2 Key Products & Segments 8.5.3 Financial Performance (2023–2025) 8.5.4 Business Strategy 8.5.5 SWOT Analysis 8.5.6 Strategic Implications (2025–2031) 8.6 MoJo 8.6.1 Company Overview 8.6.2 Key Products & Segments 8.6.3 Financial Performance (2023–2025) 8.6.4 Business Strategy 8.6.5 SWOT Analysis 8.6.6 Strategic Implications (2025–2031) 8.7 Deckiez 8.7.1 Company Overview 8.7.2 Key Products & Segments 8.7.3 Financial Performance (2023–2025) 8.7.4 Business Strategy 8.7.5 SWOT Analysis 8.7.6 Strategic Implications (2025–2031) 8.8 LyvWel 8.8.1 Company Overview 8.8.2 Key Products & Segments 8.8.3 Financial Performance (2023–2025) 8.8.4 Business Strategy 8.8.5 SWOT Analysis 8.8.6 Strategic Implications (2025–2031) 8.9 Smile Plus Energy 8.9.1 Company Overview 8.9.2 Key Products & Segments 8.9.3 Financial Performance (2023–2025) 8.9.4 Business Strategy 8.9.5 SWOT Analysis 8.9.6 Strategic Implications (2025–2031) 9. Competitive Landscape 9.1 Competitive Landscape Overview 9.1.1 Estimated Market Share by Brand, 2025 9.2 Competitive Intensity Assessment 9.2.1 Tiered Player Structure 9.2.2 Capacity versus Demand Dynamics 9.2.3 Pricing Environment 9.2.4 Barriers to Entry and Exit 9.3 Key Player Strategies & Positioning 9.3.1 Strategic Group Map Narrative 9.3.2 Differentiation Strategies Across Major Players 9.3.3 Geographic Strongholds 9.3.4 M&A and Partnership Activity (2022–Present) 9.3.5 R&D and Technology Investment Trends 9.3.6 Strategic Implications for 2026–2031 9.4 Competitive Dynamics & Strategic Outlook 9.4.1 The Competitive Landscape in Context 9.4.2 Emerging Competitive Threats 9.4.3 Consolidation vs. Fragmentation Outlook 9.4.4 Competitive Response Matrix 9.4.5 Strategic Recommendations for 2025–2031 9.4.6 Structural Outlook Summary 10. Porter's Five Forces Analysis 10.1 Threat of New Entrants 10.2 Bargaining Power of Buyers 10.3 Bargaining Power of Suppliers 10.4 Threat of Substitutes 10.5 Competitive Rivalry 11. PESTLE Analysis 11.1 Political 11.2 Economic 11.3 Sociocultural 11.4 Technological 11.5 Legal 11.6 Environmental 11.7 PESTLE Summary Assessment 12. SWOT Analysis 12.1 Industry SWOT Analysis 12.1.1 Detailed Analysis 12.1.1.1 Strengths 12.1.1.2 Weaknesses 12.1.1.3 Opportunities 12.1.1.4 Threats 12.1.2 Strategic Implications 13. Future Trends & Outlook 13.1 Overview 13.2 Trend Analysis 13.2.1 Accelerating Mainstream Retail Penetration 13.2.2 Convenience and Fuel Channel as Category Anchor 13.2.3 Multi-Channel Digital Commerce Expansion 13.2.4 Premiumization and Strength Segmentation 13.2.5 Regulatory Evolution as a Defining Market Variable 13.2.6 Demographic Targeting and the Active Lifestyle Consumer 13.2.7 Flavor and Format Innovation as Trial Catalyst 13.2.8 Subscription Economy and Loyalty Infrastructure 13.3 Trend Summary Table 13.4 Forward Outlook List of Exhibits Exhibit 2.1: Forecast of Global Market YoY Growth Rate & CAGR Summary (in %) Exhibit 2.2: Forecast of United States Caffeine Pouches (in USD Mn) Exhibit 2.3: Forecast of South (in USD Mn) Exhibit 2.4: Forecast of West (in USD Mn) Exhibit 2.5: Forecast of Midwest (in USD Mn) Exhibit 2.6: Forecast of Northeast (in USD Mn) Exhibit 3.7: Forecast of Low Strength (up to 50 mg) (in USD Mn) Exhibit 3.8: Forecast of Low Strength (up to 50 mg) (in M Cans) Exhibit 3.9: Forecast of Medium Strength (51-100 mg) (in USD Mn) Exhibit 3.10: Forecast of Medium Strength (51-100 mg) (in M Cans) Exhibit 3.11: Forecast of High Strength (above 100 mg) (in USD Mn) Exhibit 3.12: Forecast of High Strength (above 100 mg) (in M Cans) Exhibit 4.13: Forecast of Convenience Stores (in USD Mn) Exhibit 4.14: Forecast of Convenience Stores (in M Cans) Exhibit 4.15: Forecast of Online Retail (in USD Mn) Exhibit 4.16: Forecast of Online Retail (in M Cans) Exhibit 4.17: Forecast of Other Offline Retail (in USD Mn) Exhibit 4.18: Forecast of Other Offline Retail (in M Cans) Exhibit 6.19: Forecast of United States (in M Cans) Exhibit 6.20: Forecast of Northeast (in M Cans) Exhibit 6.21: Forecast of Georgia (in USD Mn) Exhibit 6.22: Forecast of North Carolina (in USD Mn) Exhibit 6.23: Forecast of Georgia (in M Cans) Exhibit 6.24: Forecast of North Carolina (in M Cans) Exhibit 6.25: Forecast of Illinois (in USD Mn) Exhibit 6.26: Forecast of Michigan (in USD Mn) Exhibit 6.27: Forecast of Illinois (in M Cans) Exhibit 6.28: Forecast of Michigan (in M Cans) Exhibit 6.29: Forecast of Northeast (in USD Mn) Exhibit 6.30: Forecast of Pennsylvania (in USD Mn) Exhibit 6.31: Forecast of Rest of Northeast (in USD Mn) Exhibit 6.32: Forecast of Northeast (in M Cans) Exhibit 6.33: Forecast of Pennsylvania (in M Cans) Exhibit 6.34: Forecast of Rest of Northeast (in M Cans) Exhibit 6.35: Forecast of Texas (in USD Mn) Exhibit 6.36: Forecast of Texas (in M Cans) Exhibit 6.37: Forecast of Florida (in USD Mn) Exhibit 6.38: Forecast of Florida (in M Cans) Exhibit 6.39: Forecast of California (in USD Mn) Exhibit 6.40: Forecast of California (in M Cans) Exhibit 6.41: Forecast of New York (in USD Mn) Exhibit 6.42: Forecast of New York (in M Cans) Exhibit 6.43: Forecast of South (in M Cans) Exhibit 6.44: Forecast of West (in M Cans) Exhibit 6.45: Forecast of Midwest (in M Cans) Exhibit 6.46: Forecast of South (in USD Mn) Exhibit 6.47: Forecast of Rest of South (in USD Mn) Exhibit 6.48: Forecast of South (in M Cans) Exhibit 6.49: Forecast of Rest of South (in M Cans) Exhibit 6.50: Forecast of West (in USD Mn) Exhibit 6.51: Forecast of Rest of West (in USD Mn) Exhibit 6.52: Forecast of West (in M Cans) Exhibit 6.53: Forecast of Rest of West (in M Cans) Exhibit 6.54: Forecast of Midwest (in USD Mn) Exhibit 6.55: Forecast of Ohio (in USD Mn) Exhibit 6.56: Forecast of Rest of Midwest (in USD Mn) Exhibit 6.57: Forecast of Midwest (in M Cans) Exhibit 6.58: Forecast of Ohio (in M Cans) Exhibit 6.59: Forecast of Rest of Midwest (in M Cans) |
*If Applicable.

NAVADHI is a market research company that helps global firms differentiate themselves, break market entry barriers, track their investments, develop business strategies and plan for future by providing actionable market research intelligence that helps them succeed.