NAVADHI Market Research
Published on NAVADHI Market Research (https://www.navadhi.com)

Home > Jordan Snapshot - PESTLE, SWOT, Risk and Macroeconomic Trends Analysis

Jordan Snapshot - PESTLE, SWOT, Risk and Macroeconomic Trends Analysis

Jordan Snapshot - PESTLE, SWOT, Risk and Macroeconomic Trends Analysis
Publication ID: 
NAV0323011
Publication Date: 
March 25, 2023
Pages: 
56
Countries: 
Jordan [1]
Please choose the suitable license type from above. More details are at given under tab "Report License Types" below.

Jordan Snapshot - PESTLE, SWOT, Risk and Macroeconomic Analysis report is designed to provide in-depth information about Jordan including it’s PESTLE (political, economic, social, technological, legal and environmental), SWOT (Strengths, Weaknesses, Opportunities and Threats) and country risk analysis backed by macroeconomic data.

Jordan is strategically positioned at the crossroads of the Middle East-North Africa (MENA) region, centrally located between Europe, Asia, and Africa. The Hashemite Kingdom of Jordan is only one of two Arab countries to have signed a peace agreement with Israel, and in 2001, it became the first Arab country to sign a Free Trade Agreement with the United States. The official language of Jordan is Arabic, and the currency is the Jordanian dinar (JOD).

Jordan Snapshot

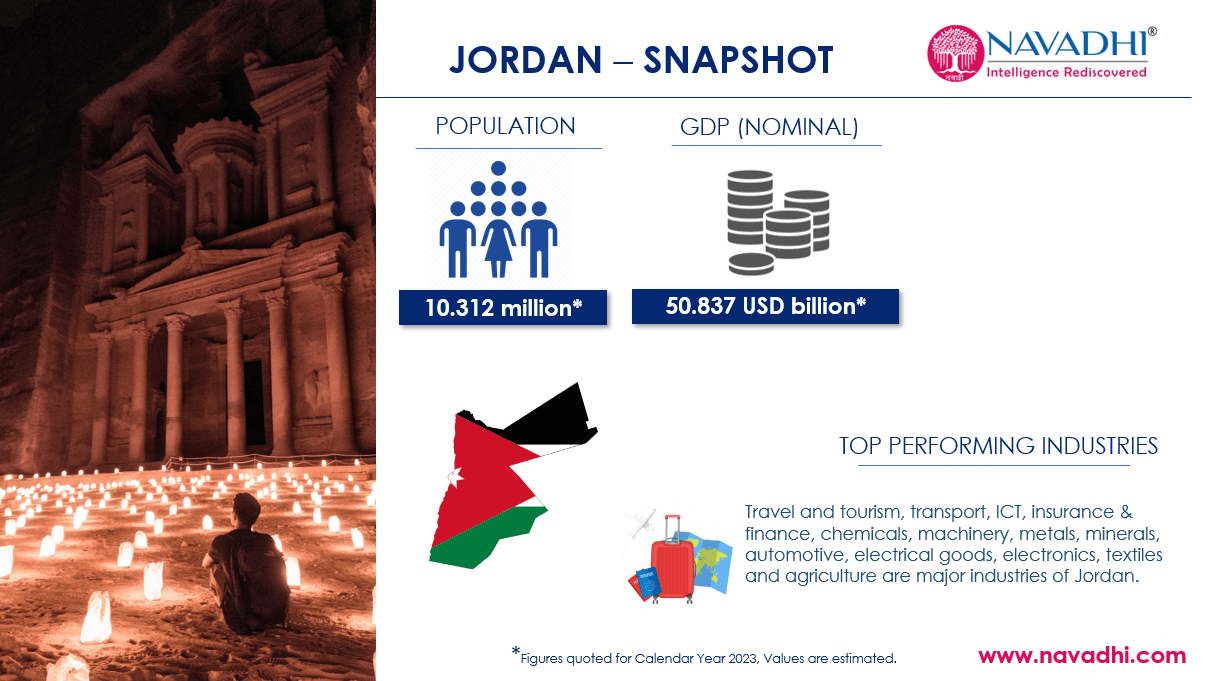
Jordan is estimated to have population of 10.312 million in the year 2023 and expected to reach 10.426 million by 2027, increasing at a CAGR of 0.28%.

Jordan’s real gross domestic product (GDP) was JOD 29.584 billion in 2020 and while recovering from the COVID-19 impact it increased by 2.16% to be around JOD 30.238 billion in 2021. It is further expected to increase by a CAGR of 3% and reach JOD 36.105 billion by 2027.

Jordan’s unemployment rate was 22.7% of total labor force in 2020. Due to slowdown in global economic activity due to COVID-19 pandemic, the unemployment in Jordan increased by 7.06% and reached 24.425% in 2021.

Jordan’s per capita GDP was USD 4,666.199 whereas purchasing power parity (PPP) based per capita GDP was USD 11,974.857 for the year 2022.

In 2022, Jordan government’s revenue was JOD 8.907 billion whereas the expenditure was JOD 10.904 billion. This resulted in Jordan government’s net lending / borrowing negative at JOD 1.997 billion in 2022 indicating that not enough financial resources were made available by the Jordan government to boost economic growth.

The current account balance for Jordan was negative USD 3.232 billion for the year 2022 and is expected to further increase at a CAGR of 4.79% and reach negative USD 2.528 billion by 2027. This negative current account balance indicates that Jordan will remain a net borrower from rest of the world till 2027.

Scope of Jordan Snapshot – PESTLE, SWOT, Risk Macroeconomic Analysis Report

  • This report provides information about key macroeconomic indicators for Jordan.
  • This report provides PESTLE (political, economic, social, technological, legal and environmental) analysis for Jordan.
  • This report provides SWOT (Strengths, Weaknesses, Opportunities and Threats) analysis for Jordan.
  • This report provides risk analysis for Jordan.
  • This report provides information on Coronavirus (COVID-19) pandemic related policy response of Jordan.

1. Executive Summary

Scope of Jordan Snapshot – PESTLE, SWOT, Risk Macroeconomic Analysis Report
Research Methodology

2. PESTLE Analysis of Jordan

2.1 Political Factors
2.2 Economic Factor
2.2.1 National Accounts Indicators
2.2.1.1 Real Gross Domestic Product
2.2.1.2 Nominal Gross Domestic Product
2.2.1.3 Gross Domestic Product Deflator
2.2.1.4 Per Capita Gross Domestic Product
2.2.1.5 Purchasing-Power-Parity (PPP) Based Per Capita GDP
2.2.1.6 Total Investment / Gross Capital Formation
2.2.1.7 Gross National Savings
2.2.2 Monetary Indicators
2.2.2.1 Consumer Price Index (CPI) Inflation
2.2.3 Trade Indicators
2.2.3.1 Change in Import Volume of Goods & Services
2.2.3.2 Change in Export Volume of Goods & Services
2.2.4 Government Finance Indicators
2.2.4.1 Government Revenue
2.2.4.2 Government Expenditure
2.2.4.3 Government Net Lending / Borrowing
2.2.4.4 Government Gross Debt
2.2.4.5 Government Net Debt
2.2.5 Balance of Payment Indicators
2.2.5.1 Current Account Balance
2.3 Social Factors
2.3.1 Population
2.3.2 Unemployment
2.4 Technological Factors
2.5 Legal Factors
2.6 Environmental Factors

3. SWOT Analysis of Jordan

3.1 Strengths
3.2 Weaknesses
3.3 Opportunities
3.4 Threats

4. Risk Analysis of Jordan

5. COVID-19 Related Policy Response of Jordan

5.1 Coronavirus (COVID-19) Containment Measures of Jordan
5.2 Coronavirus (COVID-19) Related Fiscal Policy Measures by Jordan
5.3 Coronavirus (COVID-19) Related Monetary Policy Measures by Jordan
5.4 Coronavirus (COVID-19) Related Policy Measures for MSMEs by Jordan
List of Exhibits
Notes
Company Information

List of Exhibits

Exhibit 2.1 Real GDP of Jordan (in JOD billion) 2020-2027
Exhibit 2.2 Nominal GDP of Jordan (in JOD billion) 2020-2027
Exhibit 2.3 Nominal GDP of Jordan (in USD billion) 2020-2027
Exhibit 2.4 GDP Deflator Index for Jordan 2020-2027
Exhibit 2.5 Per Capita GDP of Jordan (in USD) 2020-2027
Exhibit 2.6 PPP Per Capita GDP of Jordan (in USD) 2020-2027
Exhibit 2.7 Total Investment of Jordan (in %) 2020-2027
Exhibit 2.8 Gross National Savings of Jordan (in %) 2020-2027
Exhibit 2.9 Consumer Price Index (CPI) Inflation of Jordan 2020-2027
Exhibit 2.10 Change in Import Volume of Goods & Services of Jordan (in %) 2020-2027
Exhibit 2.11 Change in Export Volume of Goods & Services of Jordan (in %) 2020-2027
Exhibit 2.12 Government Revenue of Jordan (in JOD billion) 2020-2027
Exhibit 2.13 Government Revenue of Jordan (in % of GDP) 2020-2027
Exhibit 2.14 Government Expenditure of Jordan (in JOD billion) 2020-2027
Exhibit 2.15 Government Expenditure of Jordan (in % of GDP) 2020-2027
Exhibit 2.16 Government Net Lending / Borrowing of Jordan (in JOD billion) 2020-2027
Exhibit 2.17 Government Net Lending / Borrowing of Jordan (in % of GDP) 2020-2027
Exhibit 2.18 Government Gross Debt of Jordan (in JOD billion) 2020-2027
Exhibit 2.19 Government Gross Debt of Jordan (in % of GDP) 2020-2027
Exhibit 2.20 Government Net Debt of Jordan (in JOD billion) 2020-2027
Exhibit 2.21 Government Net Debt of Jordan (in % of GDP) 2020-2027
Exhibit 2.22 Current Account Balance of Jordan (in USD billion) 2020-2027
Exhibit 2.23 Current Account Balance of Jordan (in % of GDP) 2020-2027
Exhibit 2.24 Jordan – Top 10 Export Countries (in USD billion) & % Share in 2021
Exhibit 2.25 Jordan – Top 10 Import Countries (in USD billion) & % Share in 2021
Exhibit 2.26 Population of Jordan (in million) 2020-2027
Exhibit 2.27 Unemployment Level in Jordan (in %) 2020-2021
Exhibit 3.1 SWOT Analysis of Jordan
Exhibit 5.1 Covid-19 Policy Response for Supporting MSMEs by Jordan

Single User License (PDF)

  • This license allows for use of a publication by one person.
  • This person may print out a single copy of the publication.
  • This person can include information given in the publication in presentations and internal reports by providing full copyright credit to the publisher.
  • This person cannot share the publication (or any information contained therein) with any other person or persons.
  • Unless a Enterprise License is purchased, a Single User License must be purchased for every person that wishes to use the publication within the same organization.
  • Customers who infringe these license terms are liable for a Enterprise license fee.


Site License (PDF)*

  • This license allows for use of a publication by all users within one corporate location, e.g. a regional office.
  • These users may print out a single copy of the publication.
  • These users can include information given in the publication in presentations and internal reports by providing full copyright credit to the publisher.
  • These users cannot share the publication (or any information contained therein) with any other person or persons outside the corporate location for which the publication is purchased.
  • Unless a Enterprise License is purchased, a Site User License must be purchased for every corporate location by an organization that wishes to use the publication within the same organization.
  • Customers who infringe these license terms are liable for a Enterprise license fee.


Enterprise License (PDF)*

  • This license allows for use of a publication by unlimited users within the purchasing organization e.g. all employees of a single company.
  • Each of these people may use the publication on any computer, and may print out the report, but may not share the publication (or any information contained therein) with any other person or persons outside of the organization.
  • These employees of purchasing organization can include information given in the publication in presentations and internal reports by providing full copyright credit to the publisher.

*If Applicable.

About Us

NAVADHI is a market research company that helps global firms differentiate themselves, break market entry barriers, track their investments, develop business strategies and plan for future by providing actionable market research intelligence that helps them succeed.

Infomation

  • About Us
  • Publications
  • FAQs
  • Privacy Policy
  • Terms & Conditions
  • Careers
  • Press Releases
  • Contact

Source URL:https://www.navadhi.com/publications/jordan-snapshot-pestle-swot-risk-and-macroeconomic-trends-analysis

Links
[1] https://www.navadhi.com/countries/jordan