NAVADHI Market Research
Published on NAVADHI Market Research (https://www.navadhi.com)

Home > Israel Snapshot - PESTLE, SWOT, Risk and Macroeconomic Trends Analysis

Israel Snapshot - PESTLE, SWOT, Risk and Macroeconomic Trends Analysis

Israel Snapshot - PESTLE, SWOT, Risk and Macroeconomic Trends Analysis
Publication ID: 
NAV0323003
Publication Date: 
March 11, 2023
Pages: 
54
Countries: 
Israel [1]
Please choose the suitable license type from above. More details are at given under tab "Report License Types" below.

Israel Snapshot - PESTLE, SWOT, Risk and Macroeconomic Analysis report is designed to provide in-depth information about Israel including it’s PESTLE (political, economic, social, technological, legal and environmental), SWOT (Strengths, Weaknesses, Opportunities and Threats) and country risk analysis backed by macroeconomic data.

Israel, officially the State of Israel, is a country in Western Asia, on the south-eastern shore of the Mediterranean Sea. It shares land borders with Lebanon in the north, Syria in the northeast, Jordan on the east, the Palestinian territories, or State of Palestine, which comprises the West Bank and Gaza Strip on the east and southwest respectively, Egypt and the Gulf of Aqaba in the Red Sea to the south, and it contains geographically diverse features within its relatively small area.

Israel Snapshot

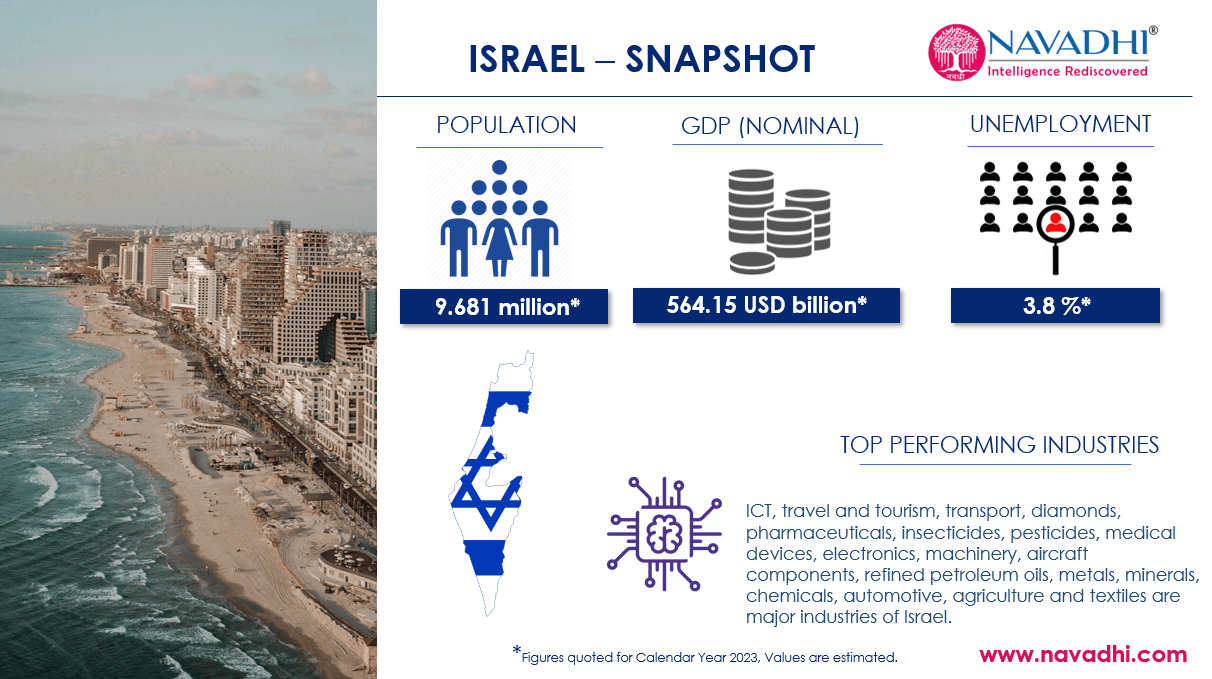
Israel is estimated to have population of 9.681 million in the year 2023 and expected to reach 10.34 million by 2027, growing at a CAGR of 1.66%.

Israel’s real gross domestic product (GDP) was ILS 1,367.398 billion in 2020 and while recovering from the COVID-19 impact it increased by 7.93% to be around ILS 1485.159 billion in 2021. It is further expected to increase by 3.65% and reach ILS 1841.801 billion by 2027.

Israel’s unemployment rate was 4.3% of total labor force in 2020. Due to slowdown in global economic activity due to COVID-19 pandemic the unemployment increased by 13.13% and reached 4.95% in 2021. Unemployment is further estimated to decrease by 4.74% and reach 3.7% of total labor force in Israel by 2027.

Israel’s per capita GDP was estimated at USD 55,358.835 whereas purchasing power parity (PPP) based per capita GDP was estimated to be at USD 52,173.077 for the year 2022.

In 2022, Israel government’s revenue was ILS 660.2 billion whereas the expenditure was ILS 658.669 billion. This resulted in Israel government’s net lending / borrowing positive at ILS 1.531 billion in 2022 indicating that enough financial resources were made available by the Israel government to boost economic growth.

The current account balance for Israel was estimated to be positive at USD 13.144 billion for the year 2022 and is expected to further decrease at a CAGR of 11.37% and reach USD 22.52 billion by 2026. This positive current account balance indicates that Israel will remain a net lender to rest of the world till 2027

Scope of Israel Snapshot – PESTLE, SWOT, Risk Macroeconomic Analysis Report

  • This report provides information about key macroeconomic indicators for Israel.
  • This report provides PESTLE (political, economic, social, technological, legal and environmental) analysis for Israel.
  • This report provides SWOT (Strengths, Weaknesses, Opportunities and Threats) analysis for Israel.
  • This report provides risk analysis for Israel.
  • This report provides information on Coronavirus (COVID-19) pandemic related policy response of Israel.
1. Executive Summary
Scope of Israel Snapshot – PESTLE, SWOT, Risk Macroeconomic Analysis Report
Research Methodology
2. PESTLE Analysis of Israel
2.1 Political Factors
2.2 Economic Factor
2.2.1 National Accounts Indicators
2.2.1.1 Real Gross Domestic Product
2.2.1.2 Nominal Gross Domestic Product
2.2.1.3 Gross Domestic Product Deflator
2.2.1.4 Per Capita Gross Domestic Product
2.2.1.5 Purchasing-Power-Parity (PPP) Based Per Capita GDP
2.2.1.6 Total Investment / Gross Capital Formation
2.2.1.7 Gross National Savings
2.2.2 Monetary Indicators
2.2.2.1 Consumer Price Index (CPI) Inflation
2.2.3 Trade Indicators
2.2.3.1 Change in Import Volume of Goods & Services
2.2.3.2 Change in Export Volume of Goods & Services
2.2.4 Government Finance Indicators
2.2.4.1 Government Revenue
2.2.4.2 Government Expenditure
2.2.4.3 Government Net Lending / Borrowing
2.2.4.4 Government Gross Debt
2.2.4.5 Government Net Debt
2.2.5 Balance of Payment Indicators
2.2.5.1 Current Account Balance
2.3 Social Factors
2.3.1 Population
2.3.2 Employment
2.3.3 Unemployment
2.4 Technological Factors
2.5 Legal Factors
2.6 Environmental Factors
3. SWOT Analysis of Israel
3.1 Strengths
3.2 Weaknesses
3.3 Opportunities
3.4 Threats
4. Risk Analysis of Israel
5. COVID-19 Related Policy Response of Israel
5.1 Coronavirus (COVID-19) Containment Measures of Israel
5.2 Coronavirus (COVID-19) Related Fiscal Policy Measures by Israel
5.3 Coronavirus (COVID-19) Related Monetary Policy Measures by Israel
5.4 Coronavirus (COVID-19) Related Employment Policy Measures by Israel
5.5 Coronavirus (COVID-19) Related Social Policy Measures by Israel
5.6 Coronavirus (COVID-19) Related Policy Measures for MSMEs by Israel
List of Exhibits
Notes
Company Information

List of Exhibits

Exhibit 2.1 Real GDP of Israel (in ILS billion) 2020-2027
Exhibit 2.2 Nominal GDP of Israel (in ILS billion) 2020-2027
Exhibit 2.3 Nominal GDP of Israel (in USD billion) 2020-2027
Exhibit 2.4 GDP Deflator Index for Israel 2020-2027
Exhibit 2.5 Per Capita GDP of Israel (in USD) 2020-2027
Exhibit 2.6 PPP Per Capita GDP of Israel (in USD) 2020-2027
Exhibit 2.7 Total Investment of Israel (in %) 2020-2027
Exhibit 2.8 Gross National Savings of Israel (in %) 2020-2027
Exhibit 2.9 Consumer Price Index (CPI) Inflation of Israel 2020-2027
Exhibit 2.10 Change in Import Volume of Goods & Services of Israel (in %) 2020-2027
Exhibit 2.11 Change in Export Volume of Goods & Services of Israel (in %) 2020-2027
Exhibit 2.12 Government Revenue of Israel (in ILS billion) 2020-2027
Exhibit 2.13 Government Revenue of Israel (in % of GDP) 2020-2027
Exhibit 2.14 Government Expenditure of Israel (in ILS billion) 2020-2027
Exhibit 2.15 Government Expenditure of Israel (in % of GDP) 2020-2027
Exhibit 2.16 Government Net Lending / Borrowing of Israel (in ILS billion) 2020-2027
Exhibit 2.17 Government Net Lending / Borrowing of Israel (in % of GDP) 2020-2027
Exhibit 2.18 Government Gross Debt of Israel (in ILS billion) 2020-2027
Exhibit 2.19 Government Gross Debt of Israel (in % of GDP) 2020-2027
Exhibit 2.20 Government Net Debt of Israel (in ILS billion) 2020-2027
Exhibit 2.21 Government Net Debt of Israel (in % of GDP) 2020-2027
Exhibit 2.22 Current Account Balance of Israel (in USD billion) 2020-2027
Exhibit 2.23 Current Account Balance of Israel (in % of GDP) 2020-2027
Exhibit 2.24 Israel – Top 10 Export Countries (in USD billion) & % Share 2022
Exhibit 2.25 Israel – Top 10 Import Countries (in USD billion) & % Share 2022
Exhibit 2.26 Population of Israel (in million) 2020-2027
Exhibit 2.27 People Employment in Israel (in million) 2020-2023
Exhibit 2.28 Unemployment Level in Israel (in %) 2020-2027
Exhibit 3.1 SWOT Analysis of Israel
Exhibit 5.1 Covid-19 Policy Response for Supporting MSMEs by Israel

Single User License (PDF)

  • This license allows for use of a publication by one person.
  • This person may print out a single copy of the publication.
  • This person can include information given in the publication in presentations and internal reports by providing full copyright credit to the publisher.
  • This person cannot share the publication (or any information contained therein) with any other person or persons.
  • Unless a Enterprise License is purchased, a Single User License must be purchased for every person that wishes to use the publication within the same organization.
  • Customers who infringe these license terms are liable for a Enterprise license fee.


Site License (PDF)*

  • This license allows for use of a publication by all users within one corporate location, e.g. a regional office.
  • These users may print out a single copy of the publication.
  • These users can include information given in the publication in presentations and internal reports by providing full copyright credit to the publisher.
  • These users cannot share the publication (or any information contained therein) with any other person or persons outside the corporate location for which the publication is purchased.
  • Unless a Enterprise License is purchased, a Site User License must be purchased for every corporate location by an organization that wishes to use the publication within the same organization.
  • Customers who infringe these license terms are liable for a Enterprise license fee.


Enterprise License (PDF)*

  • This license allows for use of a publication by unlimited users within the purchasing organization e.g. all employees of a single company.
  • Each of these people may use the publication on any computer, and may print out the report, but may not share the publication (or any information contained therein) with any other person or persons outside of the organization.
  • These employees of purchasing organization can include information given in the publication in presentations and internal reports by providing full copyright credit to the publisher.

*If Applicable.

About Us

NAVADHI is a market research company that helps global firms differentiate themselves, break market entry barriers, track their investments, develop business strategies and plan for future by providing actionable market research intelligence that helps them succeed.

Infomation

  • About Us
  • Publications
  • FAQs
  • Privacy Policy
  • Terms & Conditions
  • Careers
  • Press Releases
  • Contact

Source URL:https://www.navadhi.com/publications/israel-snapshot-pestle-swot-risk-and-macroeconomic-trends-analysis

Links
[1] https://www.navadhi.com/countries/israel