
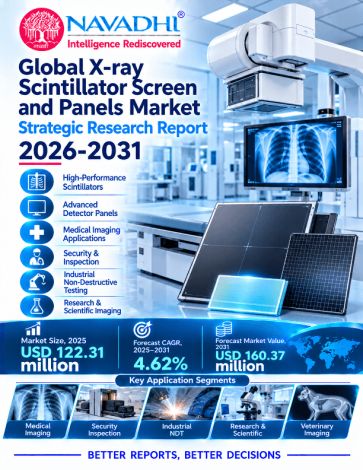

The global X-ray scintillator screen and panels market is valued at US$122.3 million in 2025 and is forecast to reach US$160.4 million by 2031, a compound annual growth rate (CAGR) of 4.6% over 2025-2031. The report measures the scintillator layer as sold to detector makers and equipment integrators: cesium iodide (CsI) screens and panels, gadolinium oxysulfide (GOS) screens and panels, barium fluorochloride (BaFCl) screens and other scintillator screens and panels. Complete flat panel detectors, CMOS and TFT sensor arrays, bulk crystals for nuclear medicine, ceramic scintillator elements for CT detectors and X-ray sources are excluded.
The report segments the market by material type and application across five regions and 28 country-level lines. CsI accounts for 63.6% of 2025 value and is the fastest growing material (6.0% CAGR), GOS holds 26.6% (2.8% CAGR), and BaFCl screens decline at about 3.7% a year. Medical Diagnostic Imaging is the largest application at 66.2% of 2025 value; Dental and Veterinary Imaging grows fastest (5.8% CAGR). Asia Pacific is the largest and fastest growing region (39.8% of 2025 value, 5.4% CAGR). Values are Navadhi Market Research estimates built bottom-up from flat panel detector value, material mix and scintillator cost share, and checked against trade data. No company discloses scintillator screen revenue, so the 2025 base is a central estimate with a wide range (US$74 million to US$208 million), and the report shows low and high growth scenarios (3.3% and 6.0% CAGR).
Scope of the Global X-ray Scintillator Screen and Panels Market Strategic Research Report
This report covers market value (US$ million) for 2022-2031, with 2025 as the base year and 2026-2031 as the forecast period. It analyses four material types, four applications, five regions and 28 country-level lines, and includes profiles of 11 companies, competitive landscape, Porter's Five Forces, PESTLE, SWOT and future trends. The report carries value only; no volume series is published because no source counts screens or panels by unit or area.
Segment by Type
Segment by Application
Who Can Use This Report?
1. Executive Summary
1.1 Market Definition and Scope
1.2 Market Size and Growth Trajectory
1.3 Principal Growth Drivers
1.4 Segment Highlights
1.5 Regional and Country Highlights
1.6 Competitive Structure
1.7 Principal Risks
1.8 Forward-Looking Outlook
2. Industry Overview & Forecast
2.1 Market Definition and Scope
2.2 Market Size and Historical Performance
2.3 Forecast and Growth Logic
2.4 Volume Analysis
2.5 Value Chain and Pricing Dynamics
3. Market Segmentation by Type
3.1 Overview of the Type Segmentation Framework
3.1.1 Cesium Iodide Screens and Panels
3.1.2 Gadolinium Oxysulfide Screens and Panels
3.1.3 Barium Fluorochloride Screens
3.1.4 Other Scintillator Screens and Panels
3.1.5 Mix Shift and Structural Implications
4. Market Segmentation by Application
4.1 Overview of Application Architecture
4.1.1 Medical Diagnostic Imaging
4.1.2 Dental and Veterinary Imaging
4.1.3 Industrial Inspection and Security
4.1.4 Research and Others
4.1.5 Comparative Analysis Across Application Segments
5. Regional Market Forecast
5.1 North America
5.1.1 Regional Overview
5.1.2 Key Growth Drivers
5.1.3 Regulatory & Infrastructure Landscape
5.1.4 Country-Level Analysis
5.1.5 Market Forecast 2025–2031
5.2 Europe
5.2.1 Regional Overview
5.2.2 Key Growth Drivers
5.2.3 Regulatory & Infrastructure Landscape
5.2.4 Country-Level Analysis
5.2.5 Market Forecast 2025–2031
5.3 Asia Pacific
5.3.1 Regional Overview
5.3.2 Key Growth Drivers
5.3.3 Regulatory & Infrastructure Landscape
5.3.4 Country-Level Analysis
5.3.5 Market Forecast 2025–2031
5.4 Latin America
5.4.1 Regional Overview
5.4.2 Key Growth Drivers
5.4.3 Regulatory & Infrastructure Landscape
5.4.4 Country-Level Analysis
5.4.5 Market Forecast 2025–2031
5.5 Middle East and Africa
5.5.1 Regional Overview
5.5.2 Key Growth Drivers
5.5.3 Regulatory & Infrastructure Landscape
5.5.4 Country-Level Analysis
5.5.5 Market Forecast 2025–2031
6. Country-Level Market Forecast
6.1 North America
6.1.1 United States
6.1.2 Canada
6.1.3 Mexico
6.2 Europe
6.2.1 Germany
6.2.2 United Kingdom
6.2.3 France
6.2.4 Italy
6.2.5 Russia
6.2.6 Rest of Europe
6.3 Asia Pacific
6.3.1 China
6.3.2 Japan
6.3.3 South Korea
6.3.4 India
6.3.5 Australia
6.3.6 Taiwan
6.3.7 Southeast Asia
6.3.8 Rest of Asia Pacific
6.4 Latin America
6.4.1 Brazil
6.4.2 Argentina
6.4.3 Colombia
6.4.4 Chile
6.4.5 Rest of Latin America
6.5 Middle East and Africa
6.5.1 GCC Countries
6.5.2 Israel
6.5.3 Turkey
6.5.4 Egypt
6.5.5 South Africa
6.5.6 Rest of Middle East and Africa
7. Growth Drivers & Inhibitors
7.1 Overview
7.2 Growth Drivers
7.2.1 Accelerating Adoption of Digital Radiography Platforms
7.2.2 Structural Shift from Gadolinium Oxysulfide to Cesium Iodide F…
7.2.3 Wireless and CMOS Detector Proliferation Driving Thin-Film Ces…
7.2.4 Industrial Inspection and Security Sector Expansion
7.2.5 Asia Pacific Market Scale and China-Led Volume Growth
7.3 Growth Restraints
7.3.1 Persistent Detector Average Selling Price Erosion Compressing…
7.3.2 Legacy Computed Radiography and Film-Screen Technology Decline
7.3.3 Concentrated Supply of Cesium Iodide Coatings Creating Structu…
7.3.4 Niche Market Scale Limiting Strategic Investment and Competiti…
7.4 Impact Assessment
7.5 Integrated Assessment
8. Key Company Profiles
8.1 Mitsubishi Chemical
8.1.1 Company Overview
8.1.2 Key Products & Segments
8.1.3 Financial Performance (2023–2025)
8.1.4 Business Strategy
8.1.5 SWOT Analysis
8.1.6 Strategic Implications (2025–2031)
8.2 Scintacor
8.2.1 Company Overview
8.2.2 Key Products & Segments
8.2.3 Financial Performance (2023–2025)
8.2.4 Business Strategy
8.2.5 SWOT Analysis
8.2.6 Strategic Implications (2025–2031)
8.3 Toray
8.3.1 Company Overview
8.3.2 Key Products & Segments
8.3.3 Financial Performance (2023–2025)
8.3.4 Business Strategy
8.3.5 SWOT Analysis
8.3.6 Strategic Implications (2025–2031)
8.4 Hamamatsu Photonics
8.4.1 Company Overview
8.4.2 Key Products & Segments
8.4.3 Financial Performance (2023–2025)
8.4.4 Business Strategy
8.4.5 SWOT Analysis
8.4.6 Strategic Implications (2025–2031)
8.5 Niterra Materials
8.5.1 Company Overview
8.5.2 Key Products & Segments
8.5.3 Financial Performance (2023–2025)
8.5.4 Business Strategy
8.5.5 SWOT Analysis
8.5.6 Strategic Implications (2025–2031)
8.6 Carestream
8.6.1 Company Overview
8.6.2 Key Products & Segments
8.6.3 Financial Performance (2023–2025)
8.6.4 Business Strategy
8.6.5 SWOT Analysis
8.6.6 Strategic Implications (2025–2031)
8.7 Acuri Technology
8.7.1 Company Overview
8.7.2 Key Products & Segments
8.7.3 Financial Performance (2023–2025)
8.7.4 Business Strategy
8.7.5 SWOT Analysis
8.7.6 Strategic Implications (2025–2031)
8.8 Agfa HealthCare
8.8.1 Company Overview
8.8.2 Key Products & Segments
8.8.3 Financial Performance (2023–2025)
8.8.4 Business Strategy
8.8.5 SWOT Analysis
8.8.6 Strategic Implications (2025–2031)
8.9 Varex Imaging
8.9.1 Company Overview
8.9.2 Key Products & Segments
8.9.3 Financial Performance (2023–2025)
8.9.4 Business Strategy
8.9.5 SWOT Analysis
8.9.6 Strategic Implications (2025–2031)
8.10 iRay Technology
8.10.1 Company Overview
8.10.2 Key Products & Segments
8.10.3 Financial Performance (2023–2025)
8.10.4 Business Strategy
8.10.5 SWOT Analysis
8.10.6 Strategic Implications (2025–2031)
8.11 Saint-Gobain Crystals
8.11.1 Company Overview
8.11.2 Key Products & Segments
8.11.3 Financial Performance (2023–2025)
8.11.4 Business Strategy
8.11.5 SWOT Analysis
8.11.6 Strategic Implications (2025–2031)
9. Competitive Landscape
9.1 Competitive Landscape Overview
9.1.1 Profiled Participants: Verified Facts
9.1.2 Why Market Shares Cannot Be Stated
9.1.3 Market Structure: Qualitative Characterisation
9.1.4 Competitive Intensity Assessment
9.2 Competitive Intensity Assessment
9.2.1 Participant Grouping by Strategic Role
9.2.2 Capacity Versus Demand Dynamics
9.2.3 Pricing Environment
9.2.4 Barriers to Entry and Exit
9.3 Key Player Strategies & Positioning
9.3.1 Strategic Group Map Narrative
9.3.2 Differentiation Strategies by Major Player
9.3.3 Selected Company Positioning Summary
9.3.4 Geographic Strongholds
9.3.5 M&A and Partnership Activity (2022–Present)
9.3.6 R&D and Technology Investment Trends
9.4 Competitive Dynamics & Strategic Outlook
9.4.1 The Competitive Landscape in Context
9.4.2 Emerging Competitive Threats
9.4.3 Consolidation vs. Fragmentation Outlook
9.4.4 Competitive Response Matrix
9.4.5 Strategic Recommendations for 2026–2031
10. Porter's Five Forces Analysis
10.1 Threat of New Entrants
10.2 Bargaining Power of Buyers
10.3 Bargaining Power of Suppliers
10.4 Threat of Substitutes
10.5 Competitive Rivalry
11. PESTLE Analysis
11.1 Strategic Environmental Assessment for the Period 2026–2031
11.2 Overview
11.3 Political
11.4 Economic
11.5 Social
11.6 Technological
11.7 Legal
11.8 Environmental
11.9 PESTLE Summary Assessment
12. SWOT Analysis
12.1 SWOT Summary Matrix
12.1.1 Detailed Analysis
12.1.2 Strengths
12.1.3 Weaknesses
12.1.4 Opportunities
12.1.5 Threats
12.1.6 Strategic Implications and Priority Actions
13. Future Trends & Outlook
13.1 Overview of the Trajectory
13.2 Trend Analysis
13.2.1 Accelerating Penetration of Wireless and CMOS-Based Detectors
13.2.2 Sustained Dominance of Cesium Iodide as the Leading Scintillat…
13.2.3 Concentrated Supply of CsI Coatings Creating Strategic Vulnera…
13.2.4 Asia Pacific Emerging as the Dominant Regional Demand Engine
13.2.5 Industrial Inspection and Security Segments Providing Volume D…
13.2.6 Price Erosion in Standard Amorphous Silicon Panels Constrainin…
13.2.7 Structural Decline of Legacy Computed Radiography and Film-Scr…
13.2.8 Market Size Ambiguity Reflecting Data Opacity and Methodologic…
13.3 Summary Trend Table
13.4 Forward Outlook
List of Exhibits
Exhibit 2.1: Forecast of Global Market YoY Growth Rate & CAGR Summary (in %)
Exhibit 2.2: Forecast of Global Market (in USD Mn)
Exhibit 2.3: Forecast of North America (in USD Mn)
Exhibit 2.4: Forecast of Europe (in USD Mn)
Exhibit 2.5: Forecast of Asia Pacific (in USD Mn)
Exhibit 2.6: Forecast of Latin America (in USD Mn)
Exhibit 2.7: Forecast of Middle East and Africa (in USD Mn)
Exhibit 3.8: Forecast of Cesium Iodide Screens and Panels (in USD Mn)
Exhibit 3.9: Forecast of Gadolinium Oxysulfide Screens and Panels (in USD Mn)
Exhibit 3.10: Forecast of Barium Fluorochloride Screens (in USD Mn)
Exhibit 3.11: Forecast of Other Scintillator Screens and Panels (in USD Mn)
Exhibit 4.12: Forecast of Medical Diagnostic Imaging (in USD Mn)
Exhibit 4.13: Forecast of Dental and Veterinary Imaging (in USD Mn)
Exhibit 4.14: Forecast of Industrial Inspection and Security (in USD Mn)
Exhibit 4.15: Forecast of Research and Others (in USD Mn)
Exhibit 6.16: Forecast of North America (in USD Mn)
Exhibit 6.17: Forecast of United States (in USD Mn)
Exhibit 6.18: Forecast of Canada (in USD Mn)
Exhibit 6.19: Forecast of Mexico (in USD Mn)
Exhibit 6.20: Forecast of Europe (in USD Mn)
Exhibit 6.21: Forecast of Germany (in USD Mn)
Exhibit 6.22: Forecast of United Kingdom (in USD Mn)
Exhibit 6.23: Forecast of France (in USD Mn)
Exhibit 6.24: Forecast of Italy (in USD Mn)
Exhibit 6.25: Forecast of Russia (in USD Mn)
Exhibit 6.26: Forecast of Rest of Europe (in USD Mn)
Exhibit 6.27: Forecast of Asia Pacific (in USD Mn)
Exhibit 6.28: Forecast of China (in USD Mn)
Exhibit 6.29: Forecast of Japan (in USD Mn)
Exhibit 6.30: Forecast of South Korea (in USD Mn)
Exhibit 6.31: Forecast of India (in USD Mn)
Exhibit 6.32: Forecast of Australia (in USD Mn)
Exhibit 6.33: Forecast of Taiwan (in USD Mn)
Exhibit 6.34: Forecast of Southeast Asia (in USD Mn)
Exhibit 6.35: Forecast of Rest of Asia Pacific (in USD Mn)
Exhibit 6.36: Forecast of Latin America (in USD Mn)
Exhibit 6.37: Forecast of Brazil (in USD Mn)
Exhibit 6.38: Forecast of Argentina (in USD Mn)
Exhibit 6.39: Forecast of Colombia (in USD Mn)
Exhibit 6.40: Forecast of Chile (in USD Mn)
Exhibit 6.41: Forecast of Rest of Latin America (in USD Mn)
Exhibit 6.42: Forecast of Middle East and Africa (in USD Mn)
Exhibit 6.43: Forecast of GCC Countries (in USD Mn)
Exhibit 6.44: Forecast of Israel (in USD Mn)
Exhibit 6.45: Forecast of Turkey (in USD Mn)
Exhibit 6.46: Forecast of Egypt (in USD Mn)
Exhibit 6.47: Forecast of South Africa (in USD Mn)
Exhibit 6.48: Forecast of Rest of Middle East and Africa (in USD Mn)
*If Applicable.

NAVADHI is a market research company that helps global firms differentiate themselves, break market entry barriers, track their investments, develop business strategies and plan for future by providing actionable market research intelligence that helps them succeed.