
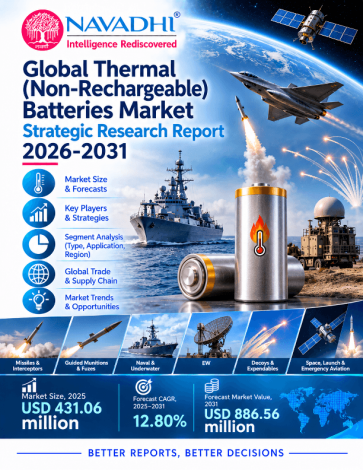

The global thermal (non-rechargeable) batteries market is estimated at US$431.1 million in 2025 (615.2 thousand units) and is forecast to reach US$886.6 million by 2031, a compound annual growth rate (CAGR) of 12.8% over 2025-2031. The 2025 base and the 2026 step (US$531.0 million) rest on one industry aggregator series and are estimates; 2022-2024 is an analyst back-cast, labelled as such.
The report segments the market by four anode chemistries and six applications across five regions. Lithium-Silicon (LiSi) anode batteries hold 61.1% of 2025 value. Missiles and Interceptors is the largest application at 48.6%. Asia Pacific is the fastest-growing region at 14.4% CAGR. The competitive analysis profiles 12 companies; company shares are not given because no source publishes thermal battery revenue by company.
Scope of the Global Thermal (Non-Rechargeable) Batteries Market Strategic Research Report
This report provides value (US$ million) and volume (thousand units) forecasts for 2026-2031 with 2025 as the base year, bear and bull scenarios, segmentation by type and application, regional and country-level forecasts, company profiles, competitive landscape, Porter's Five Forces, PESTLE, SWOT and future trends. Thermal batteries are primary, high-temperature reserve batteries whose electrolyte remains solid and non-conductive until a pyrotechnic heat source activates them.
Segment by Type
Segment by Application
Who Can Use This Report?
1. Executive Summary
1.1 Market Definition and Scale
1.2 Principal Growth Drivers
1.3 Segment Highlights
1.4 Regional and Country Highlights
1.5 Competitive Structure
1.6 Principal Risks
1.7 Forward-Looking Outlook
2. Industry Overview & Forecast
2.1 Market Definition and Scope
2.2 Size and Historical Performance
2.3 Forecast and Growth Logic
2.4 Volume Analysis
2.5 Value-Chain and Pricing
3. Market Segmentation by Type
3.1 Overview of the Type Segmentation Framework
3.1.1 Lithium-Silicon (LiSi) Anode
3.1.2 Lithium-Aluminum (LiAl) Anode
3.1.3 LAN Anode
3.1.4 Other Anode Chemistries
3.2 Volume Analysis
3.2.1 Year-by-Year Global Volume Table
3.3 Comparative Chemistry Mix and Implications
4. Market Segmentation by Application
4.1 Overview and Structural Context
4.1.1 Missiles and Interceptors
4.1.2 Guided Munitions and Fuzes
4.1.3 Naval and Underwater
4.1.4 EW Decoys and Expendables
4.1.5 Space Launch and Emergency Aviation
4.1.6 Others
4.1.7 Comparative Assessment Across Application Segments
5. Regional Market Forecast
North America
Europe
Asia Pacific
Latin America
Middle East and Africa
6. Country-Level Market Forecast
6.1 North America
6.1.1 United States
6.1.2 Rest of North America
6.2 Europe
6.2.1 Germany
6.2.2 United Kingdom
6.2.3 France
6.2.4 Italy
6.2.5 Poland
6.2.6 Spain
6.2.7 Turkiye
6.2.8 Rest of Europe
6.3 Asia Pacific
6.3.1 China
6.3.2 India
6.3.3 Japan
6.3.4 South Korea
6.3.5 Australia
6.3.6 Taiwan
6.3.7 Rest of Asia Pacific
6.4 Latin America
6.4.1 Brazil
6.4.2 Rest of Latin America
6.5 Middle East and Africa
6.5.1 Saudi Arabia
6.5.2 Israel
6.5.3 Rest of Middle East and Africa
7. Growth Drivers & Inhibitors
7.1 Strategic Context
7.2 Growth Drivers
7.2.1 Munitions Replenishment and Accelerating Rearmament Cycles
7.2.2 Capacity Expansion Investments by Leading Suppliers
7.2.3 Defence Programme Wins Validating Market Entry and Indigenous Capability
7.2.4 Localisation Mandates and Export Market Development
7.2.5 Chemistry Leadership Enabling Performance-Driven Adoption
7.3 Market Restraints and Inhibitors
7.3.1 Extended Qualification Cycles and Programme-Specific Custom Design
7.3.2 Capacity and Skills Constraints Functioning as a Systemic Bottleneck
7.3.3 Budget Variability and the Asymmetry of Spending Trends Across Geographies
7.3.4 Export Control Sensitivity and Licensing as a Structural Barrier
7.4 Impact Assessment Summary
7.5 Integrated Assessment
8. Key Company Profiles
8.1 EaglePicher Technologies (Tuthill Corporation)
8.1.1 Company Overview
8.1.2 Key Products & Segments
8.1.3 Financial Performance (2023–2025)
8.1.4 Business Strategy
8.1.5 SWOT Analysis
8.1.6 Strategic Implications (2025–2031)
8.2 ASB Group
8.2.1 Company Overview
8.2.2 Key Products & Segments
8.2.3 Financial Performance (2023–2025)
8.2.4 Business Strategy
8.2.5 SWOT Analysis
8.2.6 Strategic Implications (2025–2031)
8.3 Diehl Energy Products (Diehl Defence)
8.3.1 Company Overview
8.3.2 Key Products & Segments
8.3.3 Financial Performance (2023–2025)
8.3.4 Business Strategy
8.3.5 SWOT Analysis
8.3.6 Strategic Implications (2025–2031)
8.4 RAFAEL Advanced Defense Systems
8.4.1 Company Overview
8.4.2 Key Products & Segments
8.4.3 Financial Performance (2023–2025)
8.4.4 Business Strategy
8.4.5 SWOT Analysis
8.4.6 Strategic Implications (2025–2031)
8.5 TUBITAK SAGE
8.5.1 Company Overview
8.5.2 Key Products & Segments
8.5.3 Financial Performance (2023–2025)
8.5.4 Business Strategy
8.5.5 SWOT Analysis
8.5.6 Strategic Implications (2025–2031)
8.6 GS Yuasa
8.6.1 Company Overview
8.6.2 Key Products & Segments
8.6.3 Financial Performance (2023–2025)
8.6.4 Business Strategy
8.6.5 SWOT Analysis
8.6.6 Strategic Implications (2025–2031)
8.7 Vitzrocell
8.7.1 Company Overview
8.7.2 Key Products & Segments
8.7.3 Financial Performance (2023–2025)
8.7.4 Business Strategy
8.7.5 SWOT Analysis
8.7.6 Strategic Implications (2025–2031)
8.8 HBL Engineering
8.8.1 Company Overview
8.8.2 Key Products & Segments
8.8.3 Financial Performance (2023–2025)
8.8.4 Business Strategy
8.8.5 SWOT Analysis
8.8.6 Strategic Implications (2025–2031)
8.9 Myoniks
8.9.1 Company Overview
8.9.2 Key Products & Segments
8.9.3 Financial Performance (2023–2025)
8.9.4 Business Strategy
8.9.5 SWOT Analysis
8.9.6 Strategic Implications (2025–2031)
8.10 Missiles and Space Batteries Ltd
8.10.1 Company Overview
8.10.2 Key Products & Segments
8.10.3 Financial Performance (2023–2025)
8.10.4 Business Strategy
8.10.5 SWOT Analysis
8.10.6 Strategic Implications (2025–2031)
8.11 Wuhan Joho Technology
8.11.1 Company Overview
8.11.2 Key Products & Segments
8.11.3 Financial Performance (2023–2025)
8.11.4 Business Strategy
8.11.5 SWOT Analysis
8.11.6 Strategic Implications (2025–2031)
8.12 Lukasiewicz - Institute of Non-Ferrous Metals
8.12.1 Company Overview
8.12.2 Key Products & Segments
8.12.3 Financial Performance (2023–2025)
8.12.4 Business Strategy
8.12.5 SWOT Analysis
8.12.6 Strategic Implications (2025–2031)
9. Competitive Landscape
9.1 Competitive Landscape Overview
9.2 Competitive Intensity Assessment
9.2.1 Company Groupings by Strategic Role
9.2.2 Capacity Versus Demand Dynamics
9.2.3 Pricing Environment
9.2.4 Barriers to Entry and Exit
9.3 Key Player Strategies & Positioning
9.3.1 Strategic Group Mapping
9.3.2 Differentiation Strategies by Major Player
9.3.3 Key Company Metrics Summary
9.3.4 Geographic Strongholds
9.3.5 M&A and Partnership Activity (2022–Present)
9.3.6 R&D and Technology Investment Trends
9.4 Competitive Dynamics & Strategic Outlook
9.4.1 The Competitive Terrain in 2026–2031
9.4.2 Emerging Competitive Threats
9.4.3 Consolidation vs. Fragmentation Outlook
9.4.4 Competitive Response Matrix
9.4.5 Strategic Recommendations for 2026–2031
10. Porter's Five Forces Analysis
10.1 Threat of New Entrants
10.2 Bargaining Power of Buyers
10.3 Bargaining Power of Suppliers
10.4 Threat of Substitutes
10.5 Competitive Rivalry
11. PESTLE Analysis
11.1 Introduction
11.2 Political
11.3 Economic
11.4 Social
11.5 Technological
11.6 Legal
11.7 Environmental
11.8 PESTLE Summary Table
11.9 Synthesis
12. SWOT Analysis
12.1.1 Detailed Analysis
12.1.1.1 Strengths
12.1.1.2 Weaknesses
12.1.1.3 Opportunities
12.1.1.4 Threats
12.1.2 Strategic Implications and Priority Actions
13. Future Trends & Outlook
13.1 Overview
13.2 Key Trends Shaping the Forecast Period
13.2.1 Accelerating Missile and Interceptor Production Driving Dominant Application Demand
13.2.2 Asia Pacific Emerging as the Fastest-Growing Regional Market
13.2.3 Lithium-Silicon Chemistry Consolidating Dominant Market Share
13.2.4 Rising Average Selling Prices Reflecting Defence-Mix Upgrade Cycle
13.2.5 European Defence Rearmament Creating a Secondary Growth Pole
13.2.6 Guided Munitions Proliferation as a Structural Volume Driver
13.2.7 Capacity Expansion and Supplier Investment Signalling Supply-Side Confidence
13.2.8 Indigenisation and National Supply Chain Policies Reshaping Competitive Geography
13.3 Trend Summary Table
13.4 Forward Outlook
List of Exhibits
Exhibit 2.1: Forecast of Global Market YoY Growth Rate & CAGR Summary (in %)
Exhibit 2.2: Forecast of Global Market YoY Growth Rate & CAGR Summary (in %)
Exhibit 2.3: Forecast of Global Market (in USD Mn)
Exhibit 2.4: Forecast of North America (in USD Mn)
Exhibit 2.5: Forecast of Europe (in USD Mn)
Exhibit 2.6: Forecast of Asia Pacific (in USD Mn)
Exhibit 2.7: Forecast of Latin America (in USD Mn)
Exhibit 2.8: Forecast of Middle East and Africa (in USD Mn)
Exhibit 2.9: Forecast of Global Market (in K Units)
Exhibit 2.10: Forecast of North America (in K Units)
Exhibit 2.11: Forecast of Europe (in K Units)
Exhibit 2.12: Forecast of Asia Pacific (in K Units)
Exhibit 2.13: Forecast of Latin America (in K Units)
Exhibit 2.14: Forecast of Middle East and Africa (in K Units)
Exhibit 3.15: Forecast of Lithium-Silicon (LiSi) Anode (in USD Mn)
Exhibit 3.16: Forecast of Lithium-Silicon (LiSi) Anode (in K Units)
Exhibit 3.17: Forecast of Lithium-Aluminum (LiAl) Anode (in USD Mn)
Exhibit 3.18: Forecast of Lithium-Aluminum (LiAl) Anode (in K Units)
Exhibit 3.19: Forecast of LAN Anode (in USD Mn)
Exhibit 3.20: Forecast of LAN Anode (in K Units)
Exhibit 3.21: Forecast of Other Anode Chemistries (in USD Mn)
Exhibit 3.22: Forecast of Other Anode Chemistries (in K Units)
Exhibit 4.23: Forecast of Missiles and Interceptors (in USD Mn)
Exhibit 4.24: Forecast of Missiles and Interceptors (in K Units)
Exhibit 4.25: Forecast of Guided Munitions and Fuzes (in USD Mn)
Exhibit 4.26: Forecast of Guided Munitions and Fuzes (in K Units)
Exhibit 4.27: Forecast of Naval and Underwater (in USD Mn)
Exhibit 4.28: Forecast of Naval and Underwater (in K Units)
Exhibit 4.29: Forecast of EW Decoys and Expendables (in USD Mn)
Exhibit 4.30: Forecast of EW Decoys and Expendables (in K Units)
Exhibit 4.31: Forecast of Space Launch and Emergency Aviation (in USD Mn)
Exhibit 4.32: Forecast of Space Launch and Emergency Aviation (in K Units)
Exhibit 4.33: Forecast of Others (in USD Mn)
Exhibit 4.34: Forecast of Others (in K Units)
Exhibit 6.35: Forecast of North America (in USD Mn)
Exhibit 6.36: Forecast of United States (in USD Mn)
Exhibit 6.37: Forecast of Rest of North America (in USD Mn)
Exhibit 6.38: Forecast of North America (in K Units)
Exhibit 6.39: Forecast of United States (in K Units)
Exhibit 6.40: Forecast of Rest of North America (in K Units)
Exhibit 6.41: Forecast of Europe (in USD Mn)
Exhibit 6.42: Forecast of Germany (in USD Mn)
Exhibit 6.43: Forecast of United Kingdom (in USD Mn)
Exhibit 6.44: Forecast of France (in USD Mn)
Exhibit 6.45: Forecast of Italy (in USD Mn)
Exhibit 6.46: Forecast of Poland (in USD Mn)
Exhibit 6.47: Forecast of Spain (in USD Mn)
Exhibit 6.48: Forecast of Turkiye (in USD Mn)
Exhibit 6.49: Forecast of Rest of Europe (in USD Mn)
Exhibit 6.50: Forecast of Europe (in K Units)
Exhibit 6.51: Forecast of Germany (in K Units)
Exhibit 6.52: Forecast of United Kingdom (in K Units)
Exhibit 6.53: Forecast of France (in K Units)
Exhibit 6.54: Forecast of Italy (in K Units)
Exhibit 6.55: Forecast of Poland (in K Units)
Exhibit 6.56: Forecast of Spain (in K Units)
Exhibit 6.57: Forecast of Turkiye (in K Units)
Exhibit 6.58: Forecast of Rest of Europe (in K Units)
Exhibit 6.59: Forecast of Asia Pacific (in USD Mn)
Exhibit 6.60: Forecast of China (in USD Mn)
Exhibit 6.61: Forecast of India (in USD Mn)
Exhibit 6.62: Forecast of Japan (in USD Mn)
Exhibit 6.63: Forecast of South Korea (in USD Mn)
Exhibit 6.64: Forecast of Australia (in USD Mn)
Exhibit 6.65: Forecast of Taiwan (in USD Mn)
Exhibit 6.66: Forecast of Rest of Asia Pacific (in USD Mn)
Exhibit 6.67: Forecast of Asia Pacific (in K Units)
Exhibit 6.68: Forecast of China (in K Units)
Exhibit 6.69: Forecast of India (in K Units)
Exhibit 6.70: Forecast of Japan (in K Units)
Exhibit 6.71: Forecast of South Korea (in K Units)
Exhibit 6.72: Forecast of Australia (in K Units)
Exhibit 6.73: Forecast of Taiwan (in K Units)
Exhibit 6.74: Forecast of Rest of Asia Pacific (in K Units)
Exhibit 6.75: Forecast of Latin America (in USD Mn)
Exhibit 6.76: Forecast of Brazil (in USD Mn)
Exhibit 6.77: Forecast of Rest of Latin America (in USD Mn)
Exhibit 6.78: Forecast of Latin America (in K Units)
Exhibit 6.79: Forecast of Brazil (in K Units)
Exhibit 6.80: Forecast of Rest of Latin America (in K Units)
Exhibit 6.81: Forecast of Middle East and Africa (in USD Mn)
Exhibit 6.82: Forecast of Saudi Arabia (in USD Mn)
Exhibit 6.83: Forecast of Israel (in USD Mn)
Exhibit 6.84: Forecast of Rest of Middle East and Africa (in USD Mn)
Exhibit 6.85: Forecast of Middle East and Africa (in K Units)
Exhibit 6.86: Forecast of Saudi Arabia (in K Units)
Exhibit 6.87: Forecast of Israel (in K Units)
Exhibit 6.88: Forecast of Rest of Middle East and Africa (in K Units)
*If Applicable.

NAVADHI is a market research company that helps global firms differentiate themselves, break market entry barriers, track their investments, develop business strategies and plan for future by providing actionable market research intelligence that helps them succeed.