NAVADHI Market Research
Published on NAVADHI Market Research (https://www.navadhi.com)

Home > Global Smart Irrigation Market Research Report 2021 (by Hardware, Application and Geography)

Global Smart Irrigation Market Research Report 2021 (by Hardware, Application and Geography)

Global Smart Irrigation Market Research Report 2021 (by Hardware, Application and Geography)
Publication ID: 
NAV1217001
Publication Date: 
December 01, 2017
Pages: 
159
Countries: 
Global [1]
Please choose the suitable license type from above. More details are at given under tab "Report License Types" below.
Global Smart irrigation Market Research Report 2021
Water shortage is a treat for the world population, especially in the draught prone region with high concentrate of people. As the problem of water conservation continues to grow technology is rising to occasion to help provide solution. One of the largest usage of water is agriculture and much of agriculture water is wasted because of ineffectual practices.
 
Over the past decade, technologies have evolved to provide an effective water usage in irrigation. Smart irrigation system analyses all the environment factors affecting water need and evaporation rate such as weather and wind. Analyzing this factor determines the exact water requirement for a particular landscape on any given day.
 
Increasing government initiatives to promote water conservation, expanding farming operations cost and growing importance to increase farm profit by utilizing automated irrigation solutions are the primary factors drive the growth of global smart irrigation market. Additionally, increasing research and development investment for developing reliable irrigation scheduling solution, growing interest on developing smart irrigation solution using internet of things (IoT) and continuous advancement in sensing and monitoring technologies, accelerated the growth of global smart irrigation market. However, lack, of awareness regarding the potential benefits of smart irrigation solution and high implementation cost are the factor identified as the restraints likely to deter the progression of global smart irrigation market.
 
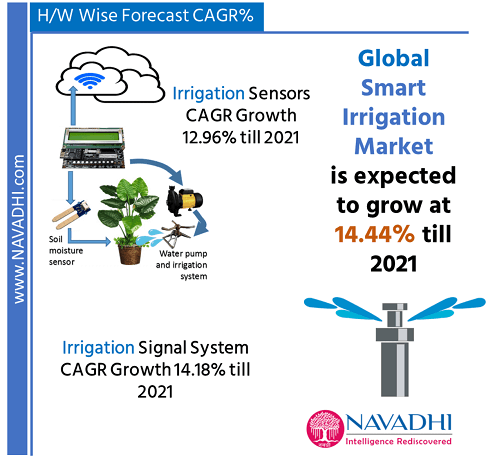
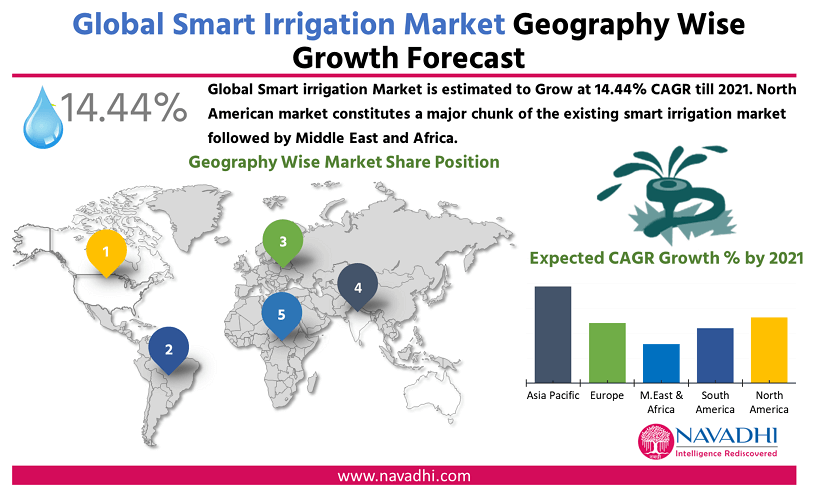
The Global Irrigation market is expected to grow at a CAGR of 14.44% till 2021. Rising demand for food production, growing need for water conservation and decrease in the recourse wastage are the key factors driving the market growth. However huge capital investment and lack of awareness are some of the factors hampering the market.
 
Global Smart Irrigation Market by Geography
 

Scope of the Global Smart Irrigation in 2021 Report

• This report provides a detailed view of smart irrigation scenario with current installed capacity and future demand.
• This report identifies the need for focusing on smart irrigation sector.
• This report provides detailed information on smart irrigation market with growth forecast up to 2022 based on geography, application type and controller base. 
• This report also focuses on developing a better understanding of the current state of the smart irrigation technology.
• This study also identifies various policies related to smart irrigation and distribution across the world.
• This report identifies the growth drivers and inhibitors for smart irrigation market.
• This report profiles ten manufacturers related to Smart Irrigation market.
• This report provides detailed competitive landscape of global smart irrigation sector.
• This report identifies major challenges faced by a new player in global smart irrigation sector.
• This report identifies the key risk associated with global smart irrigation market.
• This report provides future trends for global smart irrigation market.
• This report also provide recommendation for policy maker, end user, service provider and investors. 

1. Executive Summary

  • Scope of the Global Smart Irrigation in 2021 Report
  • Research Methodology

2. Need for Smart Irrigation System Market

3. Global Smart Irrigation System Market

3.1 Smart Irrigation Market Value Chain

4. Market Segments & Forecasts for Global Smart Irrigation System Market

4.1 Overall Forecast for Global Smart Irrigation System Market till 2021
4.2 Smart Irrigation Industry Forecast by Hardware Type
4.2.1 Sensors Systems
4.2.2 Signal Systems
4.2.3 Other Accessories:
4.3 Smart Irrigation Industry Forecast by Application Type
4.3.1 Agricultural Segment
4.3.1 Non-agricultural Segment
4.4 Smart Irrigation Industry Geography Wise
4.4.1 Asia Pacific
4.4.2 Middle East and Africa
4.4.3 Europe
4.4.4 Latin America and South America
4.4.5 North America

5. Growth inhibitors and drivers

6. Risks associated with Global Smart Irrigation System Market

6.1 Credit Risk
6.1.1 Stretched Receivables:
6.1.2 Interest rate risk:
6.1.3 Currency risk:
6.2 Policy Risk:
6.3 Technical Risk:

7. Profile of Key Players in Smart Irrigation Sector

7.1 Smart Irrigation Equipment Manufacturers
7.1.1 Libelium Comunicaciones Distribuidas S.L.
7.1.1.1 Company Profile
7.1.1.2 Libelium in Smart Irrigation Market
7.1.1.3 Financial Performance of Libelium
7.1.1.4 Business Strategy
7.1.1.4.1 Product Level Business Strategy
7.1.1.4.2 Service Level Business Strategy
7.1.1.5 SWOT Analysis for Libelium
  • Strengths
  • Weaknesses
  • Opportunities
  • Threats
7.1.2 Jain irrigation
7.1.2.2 Jain Irrigation in Smart Irrigation Value Chain
7.1.2.3 Financial Performance of Jain Irrigation
7.1.2.4 Business Strategy
7.1.2.4.1 Product Level Business Strategy
7.1.2.4.2 Service Level Business Strategy
7.1.2.5 SWOT Analysis for Jain Irrigation
  • Strengths
  • Weaknesses
  • Opportunities
  • Threats
7.1.3 Galcon
7.1.3.1 Company Profile
7.1.3.2 Galcon in Smart Irrigation Value Chain
7.1.3.3 Financial Performance of Galcon
7.1.3.4 Business Strategy
7.1.3.4.1 Product Level Business Strategy
7.1.3.4.2 Service Level Business Strategy
7.1.3.5 SWOT Analysis for Galcon
  • Strengths
  • Weaknesses
  • Opportunities
  • Threats
7.1.4 Hunter Industries Private Limited
7.1.4.1 Company Profile
7.1.4.2 Hunter Industries in Smart Irrigation Value Chain
7.1.4.3 Financial Performance of Hunter Industries Limited
7.1.4.4 Business Strategy
7.1.4.4.1 Product Level Business Strategy
7.1.4.4.2 Service Level Business Strategy
7.1.4.5 SWOT Analysis for Hunter Industry
  • Strengths
  • Weaknesses
  • Opportunities
  • Threats
7.1.5 EPC Industrié Limited
7.1.5.1 Company Profile
7.1.5.2 EPC Industrié Limited in Smart Irrigation Market
7.1.4.3 Financial Performance of EPC Industrié Limited
7.1.4.4 Business Strategy
7.1.4.4.1 Product Level Business Strategy
7.1.4.4.2 Service Level Business Strategy
7.1.1.5 SWOT Analysis for EPC Industrié Limited
  • Strengths
  • Weaknesses
  • Opportunities
  • Threats
7.1.6 Netafim Private Limited
7.1.6.1 Company Profile
7.1.6.2 Netafim in Smart Irrigation Value Chain
7.1.6.3 Financial Performance of Netafim Limited
7.1.6.4 Business Strategy
7.1.6.4.1 Product Level Business Strategy
7.1.6.4.2 Service Level Business Strategy
7.1.6.5 SWOT Analysis for Netafim Limited
  • Strengths
  • Weaknesses
  • Opportunities
  • Threat
7.1.7 Lindsay Corporation
7.1.7.1 Company Profile
7.1.7.2 Lindsay Corporation in Smart Irrigation Market
7.1.7.3 Financial Performance of Lindsay Corporation
7.1.7.4 Business Strategy
7.1.7.4.1 Product Level Business Strategy
7.1.7.4.2 Service Level Business Strategy
7.1.7.5 SWOT Analysis for Lindsay Corporation
  • Strengths
  • Weaknesses
  • Opportunities
  • Threats
7.1.8 Toro Company
7.1.8.1 Company Profile
7.1.8.2  Toro in Smart Irrigation Value Chain
7.1.8.3 Financial Performance of Toro Limited
7.1.8.4 Business Strategy
7.1.8.4.1 Product Level Business Strategy
7.1.8.5 SWOT Analysis for Toro Company
  • Strengths
  • Weaknesses
  • Opportunities
  • Threats 
7.1.9 Valmont Industries Inc.
7.1.9.1 Company Profile
7.1.9.2 Valmont Industries Inc. in Smart Irrigation Market
7.1.9.3 Financial Performance of Valmont Industries Inc.
7.1.9.4 Business Strategy
7.1.9.4.1 Product Level Business Strategy
7.1.9.4.2 Service Level Business Strategy
7.1.9.5 SWOT Analysis for Valmont Industries Inc.
  • Strengths
  • Weaknesses
  • Opportunities
  • Threats
7.1.10 Rain Bird Corporation
7.1.10.1 Company Profile
7.1.10.2 Rain Bird Corporation in Smart Irrigation Value Chain
7.1.10.3 Financial Performance of Rain Bird Corporation
11.1.1.4 Business Strategy
7.1.10.4.1 Product Level Business Strategy
7.1.10.4.2 Service Level Business Strategy
7.1.10.5 SWOT Analysis for Rain Bird Corporation
  • Strengths
  • Weaknesses
  • Opportunities
  • Threats

8. Competitive landscape in Global Smart Irrigation System Market

8.1 Merger and Acquisition
8.2 Competitive Landscape

9. Global Industrial association to Smart Irrigation

9.1 Smart water application technologies (SWAT)

10. Analysis Models

10.1 PESTLE Analysis for Smart Irrigation
10.2 Porter’s Five Forces Analysis for Smart Irrigation
10.3 SWOT Analysis for Smart Irrigation
10.3.1 Strength
10.3.2 Weaknesses
10.3.3 Opportunities
10.3.4 Threat

11. Challenges Faced by New Players in Global Smart Irrigation System Market

12. Current and Future Trends in Global Smart Irrigation System Market

13. Case Study

14. Strategic Recommendation

14.1 For Policy Makers
14.2 For End Users
14.3 For service provider
14.4 For investors

List of Exhibits

Notes

Company Information


List of Exhibits
Exhibit 2.1 World water withdrawal percentage
Exhibit 2.2 Year wise agricultural area distribution in the world
Exhibit 2.3 Global Smart Irrigation Value Chain
Exhibit 2.4 Expected rise in agricultural area in the world (table)
Exhibit 2.5 Expected rise in agricultural area in the world (graph)
Exhibit 2.6 Water availability ratio for agricultural area
Exhibit 2.7 Irrigated area Vs Agricultural area to water availability
Exhibit 2.8 Percentage of energy used in agriculture
Exhibit 2.9 Percentage of energy used in agriculture
Exhibit 3.1 Global Smart Irrigation Value Chain
Exhibit 4.1 Global Smart Irrigation Sector Turnover in Million USD
Exhibit 4.2 Global Smart Irrigation Sector Percentage Growth
Exhibit 4.3 Market share of various geographies in smart irrigation market
Exhibit 4.4 Global Smart Irrigation Sector Expected turnover in Million USD
Exhibit 4.5 Global Smart Irrigation Sector Expected Percentage Growth
Exhibit 4.6 Revenue based on hardware Segmentation-Sensor systems
Exhibit 4.7 Growth based on hardware segmentation-Sensor system
Exhibit 4.8 Estimated revenue based on hardware type- Sensor systems
Exhibit 4.9 Estimated growth based on hardware Type-Sensor System
Exhibit 4.10 Revenue based on hardware segmentation
Exhibit 4.11 Growth based on hardware segmentation
Exhibit 4.12 Estimated revenue based on hardware type-signal systems
Exhibit 4.13 Estimated growth based in hardware type-Signal Systems
Exhibit 4.14 Revenue based on hardware segmentation
Exhibit 4.15 Growth based on hardware segmentation (in percentage)
Exhibit 4.16 Estimated revenue based on hardware type
Exhibit 4.17 Revenue growth based on hardware type (In percentage)
Exhibit 4.18 Turnover Agri and Non-Agri Wise
Exhibit 4.19 Growth in revenue Agri and Non-Agri Wise
Exhibit 4.20 Estimated revenue Agri and Non-Agri Wise
Exhibit 4.21 Estimated Growth Agri and Non-Agri Wise
Exhibit 4.22 Geography wise Turnover-Asia Pacific Region
Exhibit 4.23 Geography wise Growth-Asia Pacific Region
Exhibit 4.24 Geography wise estimated Revenue-Asia Pacific Region
Exhibit 4.25 Geography wise estimated growth rate- Asia Pacific Region
Exhibit 4.26 Geography wise Turnover-Middle East and Africa
Exhibit 4.27 Geography wise Growth-Middle East and Africa
Exhibit 4.28 Geography wise estimated Revenue-Middle East and Africa
Exhibit 4.29 Geography wise estimated growth rate-Middle East and Africa
Exhibit 4.30 Geography wise Turnover-Europe
Exhibit 4.31 Geography wise Growth-Europe
Exhibit 4.32 Geography wise estimated Revenue-Europe
Exhibit 4.33 Geography wise estimated growth Rate-Europe
Exhibit 4.34 Geography wise turnover – Latin and South America
Exhibit 4.35 Geography wise Growth-Latin and South America
Exhibit 4.36 Geography wise estimated Revenue-Latin and South America
Exhibit 4.37 Geography wise estimated growth Rate- Latin and South America
Exhibit 4.38 Geography wise Turnover- North America
Exhibit 4.39 Geography wise growth Rate-North America
Exhibit 4.40 Geography wise estimated Revenue-North America
Exhibit 4.41 Geography wise estimated growth Rate-North America
Exhibit 5.1 Growth drivers and inhibitors
Exhibit 7.1 Company Profile – Libelium
Exhibit 7.2 Contact Details – Libelium
Exhibit 7.3 Libelium in Smart Irrigation Market Value Chain
Exhibit 7.4 Libelium Revenue from 2011-12 to 2015-16 (in million Euros)
Exhibit 7.5 Year-wise Libelium Revenue Growth from 2011-12 to 2015-16 (in %)
Exhibit 7.6 Estimated Libelium Revenue from 2015-16 to 2020-21 (in million Euros)
Exhibit 7.7 Estimated Year-wise Libelium Revenue Growth from 2015-16 to 2020-21 (in %)
Exhibit 7.8 Major Products and Services of Libelium
Exhibit 7.9 Application wise product combinations
Exhibit 7.10 Cost of programming devices in factory
Exhibit 7.11 SWOT Analysis of Libelium
Exhibit 7.12 Company Profile –  Jain Irrigation
Exhibit 7.13 Contact Details –  Jain Irrigation
Exhibit 7.14 Jain Irrigation in Smart Irrigation Value Chain
Exhibit 7.15 Jain Irrigation Revenue from 2011-12 to 2015-16 (in INR million)
Exhibit 7.16 Year-wise Jain Irrigation Revenue Growth from 2011-12 to 2015-16 (in %)
Exhibit 7.17 Estimated Jain Irrigation in Revenue from 2015-16 to 2020-21 (in INR million)
Exhibit 7.18 Estimated Year-wise Jain Irrigation Revenue Growth from 2015-16 to 2020-21 (in %)
Exhibit 7.19 Major Products and Services of Jain Irrigation
Exhibit 7.20 SWOT Analysis of Jain Irrigation
Exhibit 7.21 Company Profile – Galcon
Exhibit 7.22 Contact Details – Galcon
Exhibit 7.23 Galcon in Smart Irrigation Value Chain
Exhibit 7.24 Galcon Revenue from 2005-06 to 2013-14 (in USD billion)
Exhibit 7.25 Year-wise Galcon Revenue Growth from 2005-06 to 2012-13 (in %)
Exhibit 7.26 Estimated Galcon in Revenue from 2014-15 to 2018-19 (in INR billion)
Exhibit 7.27 Estimated Year-wise Galcon Revenue Growth from 2014-15 to 2018-19 (in %)
Exhibit 7.28 Major Products and Services of Galcon
Exhibit 7.29 SWOT Analysis of Galcon
Exhibit 7.30 Company Profile – Hunter Industries Energy Limited
Exhibit 7.31 Contact Details – Hunter Industry Energy Limited
Exhibit 7.32 Hunter Industry in Global Irrigation Value Chain
Exhibit 7.33 Hunter Industry Revenue from 2011-12 to 2015-16 (in USD million)
Exhibit 7.34 Year-wise Hunter Industry Revenue Growth from 201-12 to 2015-16 (in %)
Exhibit 7.35 Estimated Hunter Industry  Revenue from 2015-16 to 2020-21 (in USD million)
Exhibit 7.36 Estimated Year-wise Hunter Industry Revenue Growth from 2014-15 to 2018-19 (in %)
Exhibit 7.37 Major Products and Services of Hunter Industry
Exhibit 7.38 SWOT Analysis of Hunter Industry
Exhibit 7.39 Company Profile – EPC Industrié Limited
Exhibit 7.40 Contact Details – EPC Industrié Limited
Exhibit 7.41 EPC Industrié Limited in Smart Irrigation Market Value Chain
Exhibit 7.42 EPC Industrié Limited Revenue from Irrigation segment from 2011-12 to 2015-16 (in USD million)
Exhibit 7.43 Year-wise EPC Industrié Limited Revenue Growth from 2011-12 to 2015-16 (in %)
Exhibit 7.44 Estimated EPC Industrié Limited Revenue from 2015-16 to 2020-21 (in million USD)
Exhibit 7.45 Estimated Year-wise EPC Industrié Limited Revenue Growth from 2015-16 to 2020-21 (in %)
Exhibit 7.46 Major Products and Services of EPC Industrié Limited
Exhibit 7.47 SWOT Analysis of EPC Industrié Limited
Exhibit 7.48 Company Profile – Netafim
Exhibit 7.49 Contact Detail – Netafim
Exhibit 7.50 Netafim Limited in Smart Irrigation Value Chain
Exhibit 7.51 Netafim Revenue from 2011-12 to 2015-16 in USD Million
Exhibit 7.52 Year Wise Netafim Revenue growth from 2011-12 to 2015-16 (in %)
Exhibit 7.53 Estimate Netafim Revenue growth from 2016-17 to 2020-21 in USD Million
Exhibit 7.54 Year Wise Netafim Revenue growth from 2015-16 to 2021-21 (in %)
Exhibit 7.55 Major Products and Services of Netafim Energy Limited
Exhibit 7.56 SWOT Analysis of Netafim
Exhibit 7.57 Company Profile – Lindsay Corporation
Exhibit 7.58 Contact Details – Lindsay Corporation
Exhibit 7.59 Lindsay Corporation in Smart Irrigation Market Value Chain
Exhibit 7.60 Lindsay Corporation Revenue from Irrigation segment from 2011-12 to 2015-16 (in USD million)
Exhibit 7.61 Year-wise Lindsay Corporation Revenue Growth from 2011-12 to 2015-16 (in %)
Exhibit 7.62 Estimated Lindsay Corporation Revenue from 2015-16 to 2020-21 (in million USD)
Exhibit 7.63 Estimated Year-wise Lindsay Corporation Revenue Growth from 2015-16 to 2020-21 (in %)
Exhibit 7.64 Major Products and Services of Lindsay Corporation
Exhibit 7.65 Products and Branding strategy of Lindsay Corporation
Exhibit 7.66 SWOT Analysis of Lindsay Corporation
Exhibit 7.67 Company Profile – Toro Company
Exhibit 7.68 Company Contact – Toro Company
Exhibit 7.69 Toro Company in Smart Irrigation Market Value Chain
Exhibit 7.70 Toro Company Revenue from 2011-12 to 2015-16 in USD Million
Exhibit 7.71 Year Wise Toro Company Revenue growth from 2011-12 to 2015-16 (in %) 
Exhibit 7.72 Estimate Toro Company Revenue growth from 2016-17 to 2020-21 in USD Million
Exhibit 7.73 Year Wise Toro Company Revenue growth from 2015-16 to 2021-21 (in %)
Exhibit 7.74 Major Products and Services of Toro Company
Exhibit 7.75 SWOT Analysis of Toro Company
Exhibit 7.76 Company Profile – Valmont Industries Inc.
Exhibit 7.77 Contact Details – Valmont Industries Inc.
Exhibit 7.78 Valmont Industries Inc. in Smart Irrigation Market Value Chain
Exhibit 7.79 Valmont Industries Inc. Revenue from Irrigation segment from 2011-12 to 2015-16 (in USD
Exhibit 7.80 Year-wise Valmont Industries Inc. Revenue Growth from 2011-12 to 2015-16 (in %)
Exhibit 7.81 Estimated Valmont Industries Inc. Revenue from 2015-16 to 2020-21 (in million USD)
Exhibit 7.82 Estimated Year-wise Valmont Industries Inc. Revenue Growth from 2015-16 to 2020-21 (in %)
Exhibit 7.83 Major Products and Services of Valmont Industries Inc.
Exhibit 7.84 SWOT Analysis of Valmont Industries Inc.
Exhibit 7.85 Company Profile – Rain Bird Corporation
Exhibit 7.86 Contact Details – Rain Bird Corporation
Exhibit 7.87 Rain Bird Corporation in Wind Energy Value Chain
Exhibit 7.88 Rain Bird Corporation Revenue from 2005-06 to 2013-14 (in INR billion)
Exhibit 7.89 Year-wise Rain Bird Corporation Revenue Growth from 2005-06 to 2012-13 (in %)
Exhibit 7.90 Estimated Rain Bird Corporation in Revenue from 2015-16 to 2020-21 (in INR billion)
Exhibit 7.91 Estimated Year-wise Rain Bird Corporation Revenue Growth from 2015-16 to 2020-21 (in %)
Exhibit 7.92 Major Products and Services of Rain Bird Corporation
Exhibit 7.93 SWOT Analysis of Rain Bird Corporation
Exhibit 10.1 Porters Five Forces for smart Irrigation Industry
Exhibit 10.2 SWOT analysis for smart Irrigation Industry
Exhibit 13.1 Land profile of case study
 
  1. Libelium Comunicaciones Distribuidas S.L
  2. Jain irrigation
  3. Galcon
  4. Hunter Industries Private Limited
  5. EPC Industrié Limited
  6. Netafim Private Limited
  7. Lindsay Corporation
  8. Toro Company
  9. Valmont Industries Inc.
  10. Rain Bird Corporation

Single User License (PDF)

  • This license allows for use of a publication by one person.
  • This person may print out a single copy of the publication.
  • This person can include information given in the publication in presentations and internal reports by providing full copyright credit to the publisher.
  • This person cannot share the publication (or any information contained therein) with any other person or persons.
  • Unless a Enterprise License is purchased, a Single User License must be purchased for every person that wishes to use the publication within the same organization.
  • Customers who infringe these license terms are liable for a Enterprise license fee.


Site License (PDF)*

  • This license allows for use of a publication by all users within one corporate location, e.g. a regional office.
  • These users may print out a single copy of the publication.
  • These users can include information given in the publication in presentations and internal reports by providing full copyright credit to the publisher.
  • These users cannot share the publication (or any information contained therein) with any other person or persons outside the corporate location for which the publication is purchased.
  • Unless a Enterprise License is purchased, a Site User License must be purchased for every corporate location by an organization that wishes to use the publication within the same organization.
  • Customers who infringe these license terms are liable for a Enterprise license fee.


Enterprise License (PDF)*

  • This license allows for use of a publication by unlimited users within the purchasing organization e.g. all employees of a single company.
  • Each of these people may use the publication on any computer, and may print out the report, but may not share the publication (or any information contained therein) with any other person or persons outside of the organization.
  • These employees of purchasing organization can include information given in the publication in presentations and internal reports by providing full copyright credit to the publisher.

*If Applicable.

About Us

NAVADHI is a market research company that helps global firms differentiate themselves, break market entry barriers, track their investments, develop business strategies and plan for future by providing actionable market research intelligence that helps them succeed.

Infomation

  • About Us
  • Publications
  • FAQs
  • Privacy Policy
  • Terms & Conditions
  • Careers
  • Press Releases
  • Contact

Source URL:https://www.navadhi.com/publications/global-smart-irrigation-market-research-report-2021-hardware-application-and-geography

Links
[1] https://www.navadhi.com/countries/global