NAVADHI Market Research
Published on NAVADHI Market Research (https://www.navadhi.com)

Home > Global Smart Fabric Market Research Report 2021 (by Fabric Type, Industry Applications and Geography)

Global Smart Fabric Market Research Report 2021 (by Fabric Type, Industry Applications and Geography)

Global Smart Fabric Market Research Report 2021
Publication ID: 
NAV1217005
Publication Date: 
December 15, 2017
Pages: 
146
Countries: 
Global [1]
Please choose the suitable license type from above. More details are at given under tab "Report License Types" below.
Global Smart Fabric Market Research Report by Product Type
Growth of worldwide population puts tremendous opportunities for the textile industry. This increase in population would in turn also significantly increase the use of technology and technological products and hence the demand for them is expected to increase exponentially. 
 
In the recent years, due to the increase in disposable income among the people of the developing countries, where the population growth rate is maximum, there is a trend of increasing demand for more advanced and interactive technologically advanced products. With the increase in affinity between technology and humans, a new segment which merges the age-old textiles and the relatively new information technology sector has emerged which is being termed as smart fabrics.
 
Smart Fabrics are a very new technology which has integrated both technology and textiles, which is currently being used in varied segments of the existing industry like Military & Protection, Construction & Architecture, Healthcare, Sports & Fitness, Fashion & Entertainment and Automotive & Transportation. Smart Fabrics also the potential to be integrated in other segments as well and is expected to attain the same in the near future with the development of technology. 
 
There are numerous small and big players in the market with the big players entering as well. These companies invest in continuous research and development expenditure to meet the growing expectation of the people. These players operate across the globe and have their unique USP’s to provide value to the end users.
 
The major categories of smart fabrics are generally divided into three segments namely, Passive Smart, Active Smart and Ultra Smart textiles. Major research and development is underway to develop an Intelligent Smart Fabric. This report considers all the major geographies which includes North America, South & Latin America, Europe, Middle East & Africa and Asia Pacific.
 
Smart Fabrics are the next big thing which is going to change the dynamics of how people use technology. With giants like Google, Levi’s, & Adidas entering this segment, major changes are expected to be seen soon which will the shape the trajectory for the Smart Fabrics Industry.
 
Global Smart Fabric Market Research Report by Geography
 

Scope of the Smart Fabrics Market in 2020 Report

•This report provides a detailed view of global smart fabrics market with current demand and the forecasted demand for the market.
•This report identifies the need for focusing on the usage of smart fabrics by various segments.
•This report also provides a historical perspective of the usage and growth of smart fabrics as a growth promoter by farm house producers.
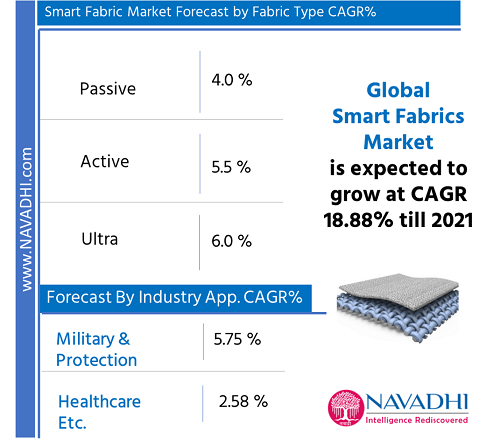
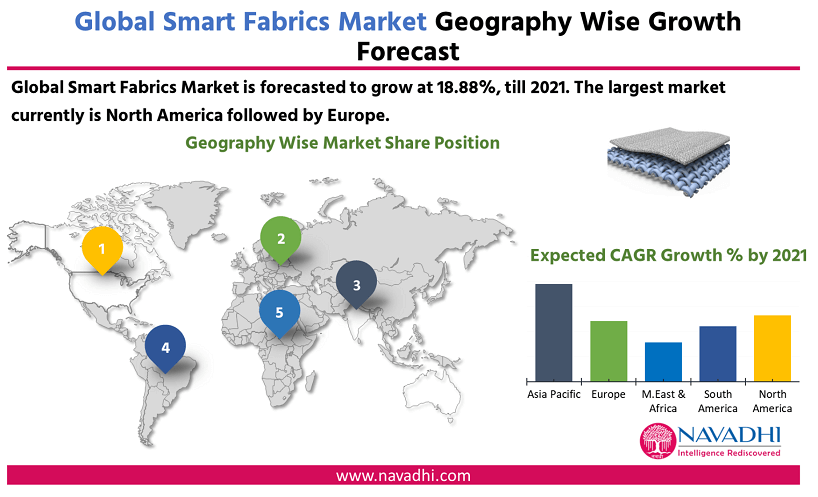
•This report provides detailed information on global smart fabrics market with growth forecasts up to 2021.
•This report also focuses on developing a better understanding of the current trends of the smart fabrics market.
•This study also identifies various policies related to smart fabrics market and distribution across various countries in the world market.
•The report identifies the growth drivers and inhibitors for the global smart fabrics market.
•This report profiles ten manufacturers related to smart fabrics market.
•This report provides detailed competitive landscape of the global smart fabrics market.
•This report also provides information regarding the global industries associations related to this industry.
•This report identifies major challenges faced by a new player in global smart fabrics market.
•The report identifies the key risks associated with the smart fabrics market.
•This report provides future trends for global smart fabrics market.
•This report also provides recommendations for policy makers.

1. Executive Summary

  • Scope of the Smart Fabrics Market in 2020 Report
  • Research Methodology

2. Need for Smart Fabrics Market
3. Global Smart Fabrics Market – Overview


3.1 Smart Fabrics Evolution
3.2 Smart Fabrics Market Value Chain


4. Market Segments and Forecast of Global Smart Fabric Market till 2021


4.1 Overall Forecast of Global Smart Fabrics Market
4.2 Smart Fabrics Industry Forecast by Fabric Type

4.2.1 Passive Smart Fabrics
4.2.2 Active Smart Fabrics
4.2.3 Ultra Smart Fabrics
4.3 Smart Fabrics Industry Forecast by Industry Type
4.3.1 Military & Protection
4.3.2 Construction & Architecture
4.3.3 Healthcare
4.3.4 Sports & Fitness
4.3.5 Fashion & Entertainment
4.3.6 Automotive & Transportation
4.4 Smart Fabrics Industry Forecast by Region
4.4.1 North America
4.4.2 Latin and South America
4.4.3 Middle East and Africa
4.4.4 Europe
4.4.5 Asia-Pacific


5. Growth Drivers and Growth Inhibitors in Smart Fabrics Industry


5.1 Growth Inhibitors
5.1.1 Lack of Awareness and Customer Skepticism
5.1.2 Lengthy Regulatory Process in Certain Segments
5.1.3 Low Priced Traditional Materials
5.1.4 Large Capital Investment
5.1.5 Technical Know-how
5.2 Growth Drivers
5.2.1 Rising Demand for Smart Devices
5.2.2 Increasing Focus on Interactive Technology
5.2.3 Greater Insights
5.2.4 High Gap between Textiles and Technology
 

6.Risks associated with Smart Fabrics market

 
6.1 Credit Risk
6.1.1 Debtor risk
6.1.2 Demand and Supply risk
6.1.3 Creditor Risk
6.1.4 Collaboration risk
6.1.5 Price fluctuation risk
6.1.7 Exchange rate fluctuation risk
6.2 Policy Risk
6.2.1 Non-uniform Tax system
6.2.2 Government policy reforms
6.3 Technical Risk
6.3.1 Automation of Production Process
6.3.2 Lack of proper logistic network
6.3.3 Lack of trained workforce
6.3.4 Cyber security risk


7. Profile of Key Players in Smart Fabrics Market


7.1 Clothing+
7.1.1.1 Company Profile
7.1.2 Clothing+ in Smart Fabrics value chain
7.1.3 Financial Performance of Clothing+
7.1.4 Business Strategy
7.1.4.1 Product Level Business Strategy
7.1.4.2 Service Level Business Strategy
7.1.5 SWOT Analysis for Clothing+
7.2 Toray Industries
7.2.1 Company Profile
7.2.2 Toray Industries in Smart Fabrics Market value chain
7.2.3 Financial Performance of Toray Industries
7.2.4 Business Strategy
7.2.4.1 Product Level Business Strategy
7.2.4.2 Service Level Business Strategy
7.2.5 SWOT Analysis for Toray Industries
7.3 QinetiQ Group plc
7.3.1 Company Profile
7.3.2 QinetiQ in Smart Fabric value chain
7.3.3 Financial Performance of QinetiQ
7.3.4 Business Strategy
7.3.4.1 Product Level Business Strategy
7.3.4.2 Service Level Business Strategy
7.2.5 SWOT Analysis for QinetiQ
7.4 AiQ Smart Clothing
7.4.1 Company Profile
7.4.2 AiQ Smart Clothing in Smart Fabric value chain
7.4.3 Financial Performance of AiQ Smart Clothing
7.4.4 Business Strategy
7.4.4.1Product Level Business Strategy
7.4.4.2 Service Level Business Strategy
7.4.5 SWOT Analysis for AiQ Smart Clothing
7.5 Textronics Inc
7.5.1 Company Profile
7.5.2 Textronics in Smart Fabrics value chain
7.5.3 Financial Performance of Textronics Inc.
7.5.4 Business Strategy
7.5.4.1 Product Level Business Strategy82
7.5.4.2 Service Level Business Strategy82
7.5.5 SWOT Analysis for Textronics Inc.83
7.6 Grado Zero Espace
7.6.1 Company Profile
7.6.2 Grado Zero Espace in Smart Fabrics Value Chain
7.6.3 Financial Performance of Grado Zero Espace
7.6.4 Business Strategy
7.6.4.1 Product Level Business Strategy
7.6.4.2 Service Level Business Strategy
7.6.5 SWOT Analysis for Grado Zero Espace
7.7 Cityzen Sciences
7.7.1 Company Profile
7.7.2 Cityzen Sciences in Smart Fabrics Value Chain
7.7.3 Financial Performance of Cityzen Sciences
7.7.4 Business Strategy
7.7.4.1 Product Level Business Strategy
7.7.4.2 Service Level Business Strategy
7.7.5 SWOT Analysis for Cityzen Sciences
7.8 EXO2 The Heat Inside
7.8.1 Company Profile
7.8.2 Position in Value Chain
7.8.3 Financial Performance
7.8.4 Business Strategy
7.8.4.1 Product Level
7.8.4.2 Service Level
7.8.5 SWOT Analysis
7.8.6 Customers
7.9 Gentherm Inc.
7.9.1 Company Profile
Gentherm Inc.
7.9.2 Position in Value Chain
7.9.3 Financial Performance
7.9.4 Business Strategy
7.9.4.1 Product Level
7.9.4.2 Service Level
7.9.5 SWOT Analysis
7.9.6 Customers
7.10 Outlast Technology
7.10.1 Company Profile
7.10.2 Position in Value Chain
7.10.3 Financial Performance
7.10.4 Business Strategy
7.10.4.1 Product Level
7.10.4.2 Service Level
7.10.5 SWOT Analysis
7.10.6 Customers
7.11 Peratech Holdco Ltd.
7.11.1 Company Profile
7.11.2 Position in Value Chain
7.11.3 Financial Performance
7.11.4 Business Strategy
7.11.4.1 Product Level
7.11.4.2 Service Level
7.11.5 SWOT Analysis
7.11.6 Customers
7.12 ThermoSoft International
7.12.1 Company Profile
7.12.2 Position in Value Chain
7.12.3 Financial Performance
7.12.4 Business Strategy
7.12.4.1 Product Level
7.12.4.2 Service Level
7.12.5 SWOT Analysis
7.12.6 Customers
 

8. Competitive Landscape in Global Smart Fabrics Market


8.1 Merger and Acquisition and Partnerships activity
8.2 Competitive Landscape
 

9. Global Industry Associations Related to Smart Fabrics Market


9.1 Industrial Fabrics Association International (IFAI)
9.2 The Advanced Functional Fabrics of America (AFFOA) Institute
 

10. Analysis Models


10.1 Porter Analysis Model
10.2 PESTLE Analysis
10.3 SWOT Analysis
 

11. Challenges Faced by New Players in Global Smart Fabrics Market

12. Current and Future Trends in Global Smart Fabrics Market

 
12.1 Current Trends
12.2 Future Trends
 

13. Case Study

14. Strategic Recommendations


14.1 For Policy Makers
14.2 For End Users
14.3 For Service providers
14.4 For Investors


List of Exhibits


Exhibit 3.1 Smart Fabric Market value chain                                    
Exhibit 4.1 Market Share of Various Geographies in Smart Fabrics Market (in %)
Exhibit 4.2 Geography wise CAGR Growth Forecast for Smart Fabrics Market (in %)
Exhibit 4.3 Forecast for Global Smart Fabrics Market (in US$ billion) 
Exhibit 4.4 Market Share by Fabric type in Smart Fabrics Market (in %)
Exhibit 4.5 Growth in various segments in Smart Fabrics Market (in %)
Exhibit 4.6 Growth in Passive Smart segment in Smart Fabrics Market (in %)
Exhibit 4.7 Growth in Active Smart segment in Smart Fabrics Market (in %)
Exhibit 4.8 Growth in Ultra Smart segment in Smart Fabrics Market (in %)
Exhibit 4.9 Market Share of Various Application in Global Smart Fabrics Market (in %)
Exhibit 4.10 Application wise Growth Forecast in Smart Fabrics Market (in %)
Exhibit 4.11 Growth in Military & Protection Segment in Smart Fabrics Market (in %)
Exhibit 4.12 Growth in Construction & Architecture Segment in Smart Fabrics Market (in %)
Exhibit 4.13 Growth in Healthcare Segment in Smart Fabrics Market (in %)
Exhibit 4.14 Growth in Sports & Fitness Segment in Smart Fabrics Market (in %)
Exhibit 4.15 Growth in Fashion & Entertainment Segment in Smart Fabrics Market (in %)
Exhibit 4.16 Growth in Automotive & Transportation Segment in Smart Fabrics Market (in %)
Exhibit 4.17 Geography wise Growth Forecast in Smart Fabrics Market (in %)
Exhibit 4.18 Growth Forecast of North America in Smart Fabrics Market (in %)
Exhibit 4.19 Growth Forecast of Latin and South America in Smart Fabric Market (in %)
Exhibit 4.20 Growth Forecast of Middle East & Africa in Smart Fabrics Market (in %)
Exhibit 4.21 Growth Forecast of Europe in Smart Fabrics Market (in %)
Exhibit 4.22 Growth Forecast of Asia-Pacific in Smart Fabrics Market (in %)
Exhibit 5.1 Growth Drivers and Inhibitors of the industry                        
Exhibit 7.1 Company Profile – Clothing+  
Exhibit 7.2 Contact Details – Clothing+   
Exhibit 7.3 Clothing+ in Smart Fabrics industry value chain   
Exhibit 7.4 Clothing+ Revenue from 2012-13 to 2016-17 (in USD)
Exhibit 7.5 Year-wise Clothing+ Revenue Growth from 2012-13 to 2016-17 (in %) 
Exhibit 7.6Estimated Clothing+ Revenue from 2017-18 to 2021-22 (in Million USD) 
Exhibit 7.7 Estimated Year-wise Clothing+ Revenue from 2017-18 to 2021-22(in %) 
Exhibit 7.8 Major Products and Services of Clothing+
Exhibit 7.9 SWOT Analysis of Clothing+
Exhibit 7.10 Company Profile – Toray 
Exhibit 7.11Contact Details – Toray 
Exhibit 7.12 Toray Industries in Smart Fabric industry value chain
Exhibit 7.13 Toray Revenue from 2012-13 to 2016-17 (in Million Yen)
Exhibit 7.14 Year-wise Toray Revenue Growth from 2012-13 to 2016-17 (in %)
Exhibit 7.15 Estimated Year-wise Toray Industries Revenue from 2017-18 to 2021-22 (in Million ¥) 
Exhibit 7.16 Estimated Year-wise Toray Industries Revenue from 2017-18 to 2021-22 (in %)  
Exhibit 7.17 Major Products and Services of Toray Industries 
Exhibit 7.18 SWOT Analysis of Toray Industries 
Exhibit 7.19 Company Profile – QinetiQ 
Exhibit 7.20 Contact Details – QinetiQ
Exhibit 7.21 QinetiQ in Smart Fabrics value chain  
Exhibit 7.22 QinetiQ revenue from 2011-12 to 2015-16 (in million £)
Exhibit 7.23 Year-wise QinetiQ Revenue Growth from 2012-13 to 2016-17 (in %)
Exhibit 7.24 Estimated QinetiQ Revenue from 2017-18 to 2021-22 (in Thousand USD)  
Exhibit 7.25 Estimated Year-wise QinetiQ Revenue from 2017-18 to 2021-22 (in %)
Exhibit 7.26 Major Products and Services of QinetiQ
Exhibit 7.27 SWOT Analysis of QinetiQ 
Exhibit 7.28 Company Profile – AiQ Smart Clothing 
Exhibit 7.29 Contact Details – AiQ Smart Clothing 
Exhibit 7.30 AiQ in Smart Fabric industry value chain 
Exhibit 7.31AiQ Smart Clothing revenue from 2011-12 to 2015-16 (in USD)
Exhibit 7.32 Year-wise AiQ Smart Clothing Revenue Growth from 2011-12 to 2015-16 (in %)  
Exhibit 7.33 Estimated AiQ Smart Clothing Revenue from 2017-18 to 2021-22 (in $)
Exhibit 7.34 Estimated Year-wise AiQ Smart Clothing Revenue from 2017-18 to 2021-22 (in %) 
Exhibit 7.35 Major Products and Services of AiQ Smart Clothing  
Exhibit 7.36 SWOT Analysis of AiQ Smart Clothing 
Exhibit 7.37 Company Profile – Textronics Inc 
Exhibit 7.38 Contact Details – Textronics Inc. 
Exhibit 7.39 Textronics in Smart Fabric Value Chain  
Exhibit 7.40 Textronics revenue from 2011-12 to 2015-16 (in $)
Exhibit 7.41 Year-wise Textronics Inc. Revenue Growth from 2011-12 to 2015-16 (in %)
Exhibit 7.42 Estimated Textronics Inc. Revenue from 2016-17 to 2020-21 (in $)  
Exhibit 7.43 Estimated Year-wise Textronics Inc. growth rate from 2016-17 to 2020-21 (in %) 
Exhibit 7.44 Major Products and Services of Textronics Inc. 
Exhibit 7.45 SWOT Analysis of Textronics Inc. 
Exhibit 7.46 Company Profile – Grado Zero Espace  
Exhibit 7.46 Company Profile – Grado Zero Espace   
Exhibit 7.48 Grado Zero Espace in Smart Fabrics Value Chain 
Exhibit 7.49 Grado Zero Espace Year-wise Revenue from 2011-12 to 2015-16 (in $)
Exhibit 7.50 Year-wise Grado Zero Espace Revenue Growth from 2011-12 to 2015-16 (in %)
Exhibit 7.51Estimated Grado Zero Espace Revenue from 2016-17 to 2020-21 (in $) 
Exhibit 7.52 Estimated Year-wise Grado Zero Espace Growth from 2016-17 to 2020-21 (in %)
Exhibit 7.53 Major Products and Services of Grado Zero Espace 
Exhibit 7.54 SWOT Analysis of Grado Zero Espace
Exhibit 7.55 Company Profile – Cityzen Sciences 
Exhibit 7.56 Contact Details – Cityzen Sciences 
Exhibit 7.57 Cityzen Sciences in Smart Fabrics Value Chain
Exhibit 7.58 Cityzen Sciences Revenue from 2011-12 to 2015-16 (in $) 
Exhibit 7.59 Year-wise Cityzen Sciences Revenue Growth from 2011-12 to 2015-16 (in %)      
Exhibit 7.60 Estimated Cityzen Sciences growth in Revenue from 2016-17 to 2020-21 (in $) 
Exhibit 7.61 Estimated Year-wise Cityzen Sciences Revenue Growth from 2016-17 to 2020-21 (in %) 
Exhibit 7.62 Major Products and Services of Cityzen Sciences 
Exhibit 7.63 SWOT Analysis of Cityzen Sciences   
Exhibit 7.64 Company Details – EXO2 
Exhibit 7.65 Contact Details – EXO2 
Exhibit 7.66 EXO2 in Global Smart Fabric Market Value Chain     
Exhibit 7.67 EXO2 in Sales from 2010-11 to 2015-16 (in USD million)
Exhibit 7.68 EXO2 in Sales from 2010-11 to 2015-16 (in %)
Exhibit 7.69 Forecasted EXO2 in Sales from 2015-16 to 2017-18 (in USD million)
Exhibit 7.70 Forecasted EXO2 in Sales from 2015-16 to 2017-18 (in %)
Exhibit 7.71 SWOT Analysis of EXO2 Inc. 
Exhibit 7.72 Company Details – Gentherm 
Exhibit 7.73 Contact Details – Gentherm 
Exhibit 7.74 Gentherm in Global Smart Fabric Market Value Chain
Exhibit 7.75 Gentherm in Sales from 2010-11 to 2015-16 (in USD million)
Exhibit 7.76 Gentherm in Sales from 2010-11 to 2015-16 (in %) 
Exhibit 7.77 Forecasted Gentherm in Sales from 2015-16 to 2017-18 (in USD million)
Exhibit 7.78 Forecasted Gentherm in Sales from 2015-16 to 2017-18 (in %)
Exhibit 7.79 Product Share in Revenue of Gentherm Inc.   
Exhibit 7.80 SWOT Analysis of Gentherm Inc. 
Exhibit 7.81 Company Details – Outlast Technology  
Exhibit 7.82 Contact Details – Outlast Technology 
Exhibit 7.83 Outlast Technology in Global Smart Fabric Market Value Chain 
Exhibit 7.84 Outlast Technology in Sales from 2010-11 to 2015-16 (in USD million)
Exhibit 7.85 Outlast Technology in Sales from 2010-11 to 2015-16 (in %) 
Exhibit 7.86 Forecasted Outlast Technology in Sales from 2015-16 to 2017-18 (in USD million)
Exhibit 7.87 Forecasted Outlast Technology in Sales from 2015-16 to 2017-18 (in %)
Exhibit 7.88 SWOT Analysis of Outlast Technology  
Exhibit 7.89 Company Details – Peratech 
Exhibit 7.90 Contact Details – Peratech
Exhibit 7.91 Peratech in Global Smart Fabric Market Value Chain   
Exhibit 7.92 Peratech in Sales from 2010-11 to 2015-16 (in USD million)
Exhibit 7.93 Peratech in Sales from 2010-11 to 2015-16 (in %) 
Exhibit 7.94 Forecasted Peratech in Sales from 2015-16 to 2017-18 (in USD million)
Exhibit 7.95 Forecasted Peratech in Sales from 2015-16 to 2017-18 (in %)
Exhibit 7.96 SWOT Analysis of Peratech Inc.
Exhibit 7.97 Company Details – ThermoSoft  
Exhibit 7.98 Contact Details – ThermoSoft 
Exhibit 7.99 ThermoSoft in Global Smart Fabric Market Value Chain 
Exhibit 7.100 ThermoSoft in Sales from 2010-11 to 2015-16 (in USD million)
Exhibit 7.101 ThermoSoft in Sales from 2010-11 to 2015-16 (in %)  
Exhibit 7.102 Forecasted ThermoSoft in Sales from 2015-16 to 2017-18 (in USD million)
Exhibit 7.103. Forecasted ThermoSoft in Sales from 2015-16 to 2017-18 (in %)
Exhibit 7.104 SWOT Analysis of ThermoSoft International  
Exhibit 13.1 Most Common Injuries Suffered by Athletes in 2014
  1. Clothing+
  2. Toray Industries
  3. QinetiQ Group plc
  4. AiQ Smart Clothing
  5. Textronics Inc
  6. Grado Zero Espace
  7. Cityzen Sciences
  8. EXO2 The Heat Inside
  9. Gentherm Inc.
  10. Outlast Technology
  11. Peratech Holdco Ltd.
  12. ThermoSoft International

Single User License (PDF)

  • This license allows for use of a publication by one person.
  • This person may print out a single copy of the publication.
  • This person can include information given in the publication in presentations and internal reports by providing full copyright credit to the publisher.
  • This person cannot share the publication (or any information contained therein) with any other person or persons.
  • Unless a Enterprise License is purchased, a Single User License must be purchased for every person that wishes to use the publication within the same organization.
  • Customers who infringe these license terms are liable for a Enterprise license fee.


Site License (PDF)*

  • This license allows for use of a publication by all users within one corporate location, e.g. a regional office.
  • These users may print out a single copy of the publication.
  • These users can include information given in the publication in presentations and internal reports by providing full copyright credit to the publisher.
  • These users cannot share the publication (or any information contained therein) with any other person or persons outside the corporate location for which the publication is purchased.
  • Unless a Enterprise License is purchased, a Site User License must be purchased for every corporate location by an organization that wishes to use the publication within the same organization.
  • Customers who infringe these license terms are liable for a Enterprise license fee.


Enterprise License (PDF)*

  • This license allows for use of a publication by unlimited users within the purchasing organization e.g. all employees of a single company.
  • Each of these people may use the publication on any computer, and may print out the report, but may not share the publication (or any information contained therein) with any other person or persons outside of the organization.
  • These employees of purchasing organization can include information given in the publication in presentations and internal reports by providing full copyright credit to the publisher.

*If Applicable.

About Us

NAVADHI is a market research company that helps global firms differentiate themselves, break market entry barriers, track their investments, develop business strategies and plan for future by providing actionable market research intelligence that helps them succeed.

Infomation

  • About Us
  • Publications
  • FAQs
  • Privacy Policy
  • Terms & Conditions
  • Careers
  • Press Releases
  • Contact

Source URL:https://www.navadhi.com/publications/global-smart-fabric-market-research-report-2021-fabric-type-industry-applications-and

Links
[1] https://www.navadhi.com/countries/global