NAVADHI Market Research
Published on NAVADHI Market Research (https://www.navadhi.com)

Home > Global Seed Market Research Report 2021 (by Crop Type, Treatment and Geography)

Global Seed Market Research Report 2021 (by Crop Type, Treatment and Geography)

Global Seed Market Research Report 2021
Publication ID: 
NAV0817001
Publication Date: 
August 18, 2017
Pages: 
158
Countries: 
Global [1]
Please choose the suitable license type from above. More details are at given under tab "Report License Types" below.
Global Seed Market Research Report 2021
The global seed market is highly oligopolistic in nature dominated by companies like Monsanto, DuPont, Syngenta and Bayer to name a few. The demand for seeds is on the rise due to global population rise and thus the Seed market is a highly growing one. 
 
The objective of this research study is to understand the current Seed market across the world and to estimate the growth rate for the next 5 years. The report covers the detailed analysis of 12 companies- their value chain, financial performance and forecast, Business strategy, SWOT analysis which are involved in breeding and production of seeds and having presence across different regions of the world. The details of the company and certifications are also mentioned in this report.
 
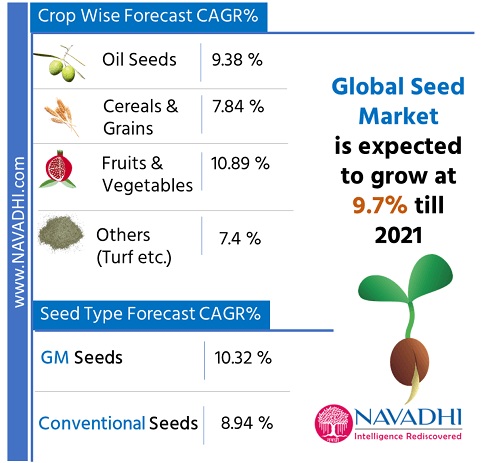
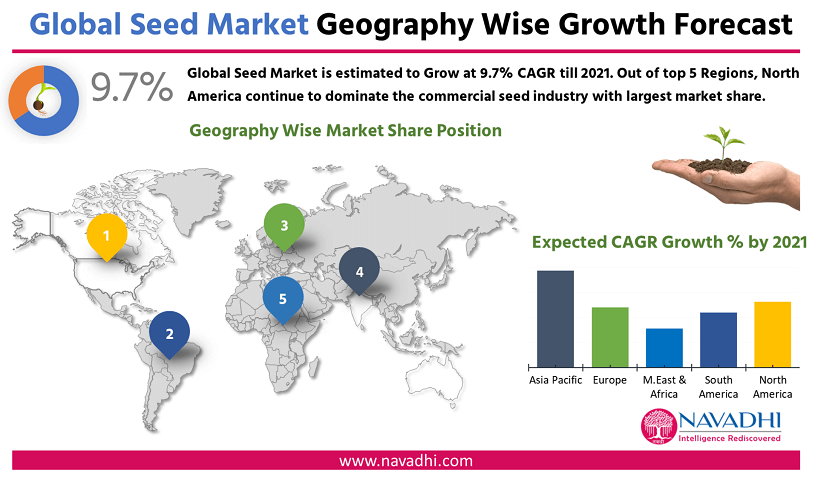
The global seed market is to grow at a CAGR of 9.7% by the year 2021.
 
The end users of seed are farmers or anyone who grows it for cultivation. Cereals and grains, oil seeds, fruits and vegetables and other seeds are the major seeds produced in that order globally. Increasing demand for global food production, increase in the use of commercial seeds, increase in the use of GM seeds, development in nonfood seed market, sustainable increase in productivity are some of the key factors which will drive the growth of seed industry.
 
This report concludes by analyzing the industry through PESTLE, Porters 5 forces and SWOT, discusses the challenges faced by the new players entering the industry and present and future trends observed. Strategic recommendations are also discussed separately and in detail for policy maker, end users, service providers and investors in the report.
 
Global Seed Market by Geography
 

Scope of Global Seed Market Research Report 

  • This report provides a detailed view of global seed market with the current market value as well as projections for future market potential and growth rate.
  • This report identifies the need for seed production globally.
  • This report provides detailed information on the value chain as well as the different market segments and their segment wise market share and growth potential.
  • This report provides detailed information on product wise growth forecasts for Seed market globally by 2021.
  • This report identifies the growth drivers and inhibitors for seed market globally.
  • This study also identifies policies related to Seed market globally.
  • This report identifies various credit, policy and technical risks associated with seed market globally.
  • This report has detailed profiles of 12 key players in the world in seed industry covering their business strategy, financial performance, future forecasts and SWOT analysis
  • This report covers in detail the competitive landscape in detail of global seed market.
  • This report identifies the key industry bodies and associations and their role in global seed market.
  • This report provides PESTLE (political, economic, social, technological, legal and environmental) analysis for global seed market.
  • This report provides porters five forces analysis for global seed market
  • This report provides SWOT (strength, weaknesses, opportunities, threats) analysis for global seed market

1. Executive Summary

1.1 Research Objectives
1.2 Research Methodology
1.3 Key Findings
1.4 Scope of Report

2. Need for Seed Market

3. Seed Market Value Chain

4. Market Segments & Forecasts for Global Seed Market

4.1 Overall Forecast for Global Seed Market till 2021
4.2 Seed Industry Forecast by Crop Wise
4.2.1 Oilseeds
4.2.2 Cereals & Grains
4.2.3 Fruits & Vegetables
4.2.4 Others (Forage, Turf grass seeds etc.)
4.3 Seed Industry Forecast by Type
4.3.1 Genetically Modified (GM) Seeds
4.3.2 Conventional Seeds
4.4 Seed Industry Forecast by Treatment
4.4.1 Treated
4.4.2 Non-Treated
4.5 Seed Industry Forecast by Crop Traits
4.5.1 Transgenic Seeds
4.5.2 Stacked Traits
4.6 Seed Industry Forecast by Geography
4.6.1 North America
4.6.2 Latin and South America (LASA)
4.6.3 Middle East and Africa
4.6.4 Europe
4.6.5 Asia Pacific

5. Growth Drivers and Inhibitors for Global Seed Market

5.1 Growth Drivers
5.2 Growth Inhibitors

6. Risks associated with Global Seed Market

6.1 Credit Risk
6.1.1 Currency risk
6.1.2 Cost risk
6.2 Policy Risk (Government)
6.2.1 Trade Restrictions
6.2.2 Regulatory Policies
6.3 Technical Risk
6.3.1 Equipment breakdown
6.3.2 Infrastructure risk
6.3.3 Development risk

7. Profile of Key Players in Global Seed Market

7.1 Advanta seeds (India)
7.1.1 Company Profile
7.1.2 Advanta Limited in Seed Value Chain
7.1.3 Financial Performance of Advanta
7.1.4 Business Strategy
7.1.5 SWOT Analysis for Advanta Limited
  • Strengths
  • Weaknesses
  • Opportunities
  • Threats
7.2 S&W Seeds (US)
7.2.1 Company Profile
7.2.2. S and W seed co. Seed Value Chain
7.2.3 Financial Performance of S and W Co Limited
7.2.4 Business Strategy
7.2.5 SWOT Analysis for S and W Seed Co Limited
  • Strengths
  • Weaknesses
  • Opportunities
  • Threats
7.3 Syngenta (Switzerland)
7.3.1 Company Profile
7.3.2 Syngenta in Seed Value Chain
7.3.3 Financial Performance of Syngenta
7.3.4 Business Strategy
7.3.5 SWOT Analysis for Syngenta Limited
  • Strengths
  • Weaknesses
  • Opportunities
  • Threats
7.4 Monsanto (US)
7.4.1 Company Profile
7.4.2 Monsanto in Seed Industry Value Chain
7.4.3 Financial Performance of Monsanto
7.4.4 Business Strategy
7.4.4.1 Product Level Business Strategy
7.4.4.2 Service Level Business Strategy
7.4.5 SWOT Analysis for Monsanto
  • Strengths
  • Weaknesses
  • Opportunities
  • Threats
7.5 DuPont (US)
7.5.1 Company Profile
7.5.2 DuPont in Seed Value Chain
7.5.3 Financial Performance of DuPont
7.5.4 Business Strategy
7.5.4.1 Product Level Business Strategy
7.5.4.2 Service Level Business Strategy
7.5.5 SWOT Analysis for DuPont
  • Strengths
  • Weaknesses
  • Opportunities
  • Threats
7.6 Seed Co (Africa)
7.6.1 Company Profile
7.6.2 Seed Co in Seed Value Chain
7.6.3 Financial Performance of Seed Co
7.6.4 Business Strategy
7.5.5 SWOT Analysis for Seed Co
  • Strengths
  • Weaknesses
  • Opportunities
  • Threats
7.7 Vilmorin & Cie (France)
7.7.1 Company Profile
7.7.2 Vilmorin & Cie Value Chain
7.7.3 Financial Performance of Vilmorin & Cie
7.7.4 Business Strategy
7.7.4.1 Product Level Business Strategy
7.7.5 SWOT Analysis for Vilmorin & Cie
  • Strengths
  • Weaknesses
  • Opportunities
  • Threats
7.8 Land O’ Lakes (US)
7.8.1 Company Profile
7.8.2 Land O’ Lakes Value Chain
7.8.3 Financial Performance of Land O’ Lakes – Crop Inputs
7.8.4 Business Strategy
7.8.4.1 Product Level Business Strategy
7.8.4.2 Service Level Business Strategy
7.8.5 SWOT Analysis for Land O’ Lakes
  • Strengths
  • Weaknesses
  • Opportunities
  • Threats
7.9 KWS SAAT SE (Germany)
7.9.1 Company Profile
7.9.2 KWS Value Chain
7.9.3 Financial Performance of KWS SAAT SE
7.9.4 Business Strategy
7.9.4.1 Product Level Business Strategy
7.9.4.2 Service Level Business Strategy
7.9.5 SWOT Analysis for KWS SAAT SE
  • Strengths
  • Weaknesses
  • Opportunities
  • Threats
7.10 Bayer CropScience (Germany)
7.10.1 Company Profile
7.10.2 Bayer CropScience Value Chain
7.10.3 Financial Performance of Bayer CropScience - Seeds
7.10.4 Business Strategy
7.10.4.1 Product Level Business Strategy
7.10.4.2 Service Level Business Strategy
7.10.5 SWOT Analysis for Bayer Crop science
  • Strengths
  • Weaknesses
  • Opportunities
  • Threats
7.11 Sakata Seed Corporation (Japan)
7.11.1 Company Profile
7.11.2 Sakata Seed Corporation Value Chain
7.11.3 Financial Performance of Sakata Seed
7.11.4 Business Strategy
7.11.4.1 Product Level Business Strategy
7.11.4.2 Service Level Business Strategy
7.11.5 SWOT Analysis for Sakata Seed
  • Strengths
  • Weaknesses
  • Opportunities
  • Threats
7.12 DLF-Trifolium
7.12.1 Company Profile
7.12.2 DLF Trifolium Value Chain
7.12.3 Financial Performance of DLF Trifolium
7.12.4 Business Strategy
7.12.4.1 Product Level Business Strategy
7.12.4.2 Service Level Business Strategy
7.12.5 SWOT Analysis for DLF Trifolium
  • Strengths
  • Weaknesses
  • Opportunities
  • Threats

8. Competitive Landscape in Global Seed Market

8.1 Competitive Landscape
8.2 Mergers & Acquisitions

9. Global Industry Associations Related to Seed Market

9.1 Food and Agricultural Organization of the United
9.2 National seed association of India
9.3 African Seed trade association
9.4 American Seed Trade Association
9.5 European Seed Association

10. Analysis Models

10.1 PESTLE Analysis
10.1.1 Political
10.1.2 Economic
10.1.3 Social
10.1.4 Technological
10.1.5 Legal
10.1.6 Environmental
10.2 Porter’s Five Forces
  • Threat of New Entrants
  • Bargaining Power of Suppliers
  • Bargaining Power of Buyers
  • Rivalry among Existing Firms
  • Threat of Substitutes
10.3 SWOT Analysis
  • Strengths
  • Weaknesses
  • Opportunities
  • Threats

11. Challenges Faced by New Players in Global Seed Market

11.1 Availability of Existing Genetic Resources, Expertise and Time
11.2 High Investment
11.3 Oligopolistic Market Structure
11.4 Intellectual Property Rights

12. Current and Future Trends in Global Seed Market

12.1 Biofuel popularity
12.2 Increasing demand for agricultural crops
12.3 Stronger intellectual property rights
12.4 Increasing use of certified seeds
12.5 Popularity of organic seeds

13. Case Study

13.1 Open Source Seed Initiative – Freeing the Seed

14. Strategic Recommendations

14.1 For Policy Makers
14.2 For End Users
14.3 For Service Providers
14.4 For Investors

15. Appendix

  • Questionnaire design
  • List of Exhibits
  • Notes
  • Company Information
List of Exhibits:
Exhibit 3.1 Seed market value chain
Exhibit 4.1 Forecast of global seed market 2017-21 (Billion dollar) 
Exhibit 4.2 Global seed market share crop wise (%)
Exhibit 4.2b CAGR Growth Forecast for Seeds Market Crop Wise 2017-21(%) 
Exhibit 4.2.1 Forecast of Oilseeds Seed Market 2017-21(Billion dollar) 
Exhibit 4.2.2 Forecast of Cereals & Grains Seed market 2017-21(Billion dollar)
Exhibit 4.2.3 Forecast of Fruits & Vegetables Seed Market 2017-21 (Billion dollar)
Exhibit 4.2.4 Forecast of Others Seed Market 2017-21 (Billion dollar)
Exhibit 4.3a Global Seed market share by crop type (%) 
Exhibit 4.3b CAGR Growth Forecast for Seeds market based on crop type 2017-21 (%)
Exhibit 4.3.1 Forecast of GM Seed Market 2017-21 (Billion dollar) 
Exhibit 4.3.2 Forecast of Conventional Seed Market 2017-21 (Billion dollar)
Exhibit 4.4 CAGR Growth Forecast for Seeds Market based on Crop treatment 2017-21(%) 
Exhibit 4.4.1 Forecast of Treated Seed Market 2017-21(Billion dollar) 
Exhibit 4.4.2 Forecast of Non treated Seed Market 2017-21(Billion dollar)
Exhibit 4.5 Forecast of Transgenic Seed Market 2017-21(Billion dollar) 
Exhibit 4.5.3 Forecast of Stacked Traits Seed Market 2017-21(Billion dollar) 
Exhibit 4.6a Market Share of various Geographies in Global Seed Market-2016 (%)
Exhibit 4.6b Geography wise CAGR growth forecast for global Seed market 2017-21 (%)
Exhibit 4.6.1 Forecast of North America Seed Market 2017-21(Billion dollar)
Exhibit 4.6.2 Forecast of South America Seed Market 2017-21(Billion dollar) 
Exhibit 4.6.3 Forecast of Middle East and Africa Seed Market 2017-21(Billion dollar)
Exhibit 4.6.4 Forecast of Europe Seed Market 2017-21(Billion dollar)
Exhibit 4.6.5 Forecast of Asia pacific Seed Market 2017-21(Billion dollar)
Exhibit 5.1Growth drivers and Inhibitors for global Seed Industry
Exhibit 7.1 Company Profile – Advanta Limited  
Exhibit 7.2 Contact Details – Advanta Limited 
Exhibit 7.3 Advanta Limited in Seed Industry Value Chain
Exhibit 7.4 Advanta Limited Revenue from 2011-12 to 2015-16 (in Million dollars)
Exhibit 7.5 Year-wise Advanta Limited Revenue Growth from 2011-12 to 2015-16 (in %) 
Exhibit 7.6 Estimated Advanta Limited in Revenue from 2016-17 to 2020-21 (in million dollars)
Exhibit 7.7 Estimated Year-wise Advanta Limited Revenue Growth from 2016-17 to 2020-21 (in %)
Exhibit 7.8 Major Products of Advanta Limited
Exhibit 7.9 SWOT Analysis of Advanta Limited
Exhibit 7.2.1 Company Profile – S and W Seed Co
Exhibit 7.2.2 Contact Details – S and W seed Co Limited
Exhibit 7.2.3 S and W Seed Co in Seed Industry Value Chain
Exhibit 7.2.4 S and W seed Co from 2011-12 to 2015-16 (in Million dollars) 
Exhibit 7.2.5 Year-wise S and W Seed Co Revenue Growth from 2011-12 to 2015-16 (in %)
Exhibit 7.2.6 Estimated S and W Seed Co in Revenue from 2016-17 to 2020-21 (in million dollars)
Exhibit 7.2.7 Estimated Year-wise S and W Seed Co Revenue Growth from 2016-17to 2020-21(in %)
Exhibit 7.2.8 Major Products of S and W Seed Co Limited
Exhibit 7.2.9 SWOT Analysis of S and W Seed Co
Exhibit 7.3.1 Company Profile – Syngenta                 
Exhibit 7.3.2 Contact Details – Syngenta  
Exhibit 7.3.3 Syngenta in Seed Industry Value Chain
Exhibit 7.3.4 Syngenta from 2011-12 to 2015-16 (in Million dollars) 
Exhibit 7.3.5 Year-wise Syngenta Revenue Growth from 2011-12 to 2015-16 (in %)
Exhibit 7.3.6 Estimated Syngenta in Revenue from 2016-17 to 2020-21 (in million dollars)
Exhibit 7.3.7 Estimated Year-wise Syngenta Revenue Growth from 2016-17to 2020-21(in %)
Exhibit 7.3.8 Major Products of Syngenta
Exhibit 7.3.9 SWOT Analysis of Syngenta
Exhibit 7.4.1 Company Profile – Monsanto
Exhibit 7.4.2 Contact Details – Monsanto 
Exhibit 7.4.3 Monsanto in Seed Industry Value Chain 
Exhibit 7.4.4 Monsanto from 2011-12 to 2015-16 (in Million dollars) 
Exhibit 7.4.5 Year-wise Monsanto Revenue Growth from 2011-12 to 2015-16 (in %) 
Exhibit 7.4.6 Estimated Monsanto in Revenue from 2016-17 to 2020-21 (in million dollars) 
Exhibit 7.4.7 Estimated Year-wise Monsanto Revenue Growth from 2016-17to 2020-21(in %)
Exhibit 7.4.8 Major Products of Monsanto 
Exhibit 7.4.9 SWOT Analysis of Monsanto 
Exhibit 7.5.1 Company Profile – DuPont                   
Exhibit 7.5.2 Contact Details – DuPont
Exhibit 7.5.3 DuPont in Seed Industry Value Chain               
Exhibit 7.5.4 DuPont from 2011-12 to 2015-16 (in Million dollars) 
Exhibit 7.5.5 DuPont Revenue Growth from 2011-12 to 2015-16 (in %)
Exhibit 7.5.6 Estimated DuPont in Revenue from 2016-17 to 2020-21 (in million dollars)
Exhibit 7.5.7 Estimated Year-wise DuPont Revenue Growth from 2016-17to 2020-21(in %) 
Exhibit 7.5.8 Major Products of DuPont Limited  
Exhibit 7.5.9 SWOT Analysis of DuPont 
Exhibit 7.6.1 Company Profile – Seed Co 
Exhibit 7.6.2 Contact Details – Seed Co 
Exhibit 7.6.3 Seed Co in Seed Industry Value Chain               
Exhibit 7.6.4 Seed Co from 2011-12 to 2015-16 (in Million dollars)
Exhibit 7.6.5 Year-wise Seed Co Revenue Growth from 2011-12 to 2015-16 (in %)
Exhibit 7.6.6 Estimated Seed Co in Revenue from 2016-17 to 2020-21 (in million dollars) 
Exhibit 7.6.7 Estimated Seed Co Revenue Growth from 2016-17to 2020-21(in %)
Exhibit 7.6.8 Major Products of Seed Co Limited 
Exhibit 7.6.9 SWOT Analysis of Seed Co  
Exhibit 7.7.1 Company Profile – Vilmorin & Cie 
Exhibit 7.7.2 Contact Details – Vilmorin & Cie 
Exhibit 7.7.3 Vilmorin & Cie in Seed Industry Value Chain
Exhibit 7.7.4 Vilmorin & Cie from 2011-12 to 2015-16 (in Million dollars)
Exhibit 7.7.5 Year-wise Vilmorin & Cie Revenue Growth from 2011-12 to 2015-16 (in %)
Exhibit 7.7.6 Estimated Vilmorin & Cie in Revenue from 2016-17 to 2020-21 (in million dollars)
Exhibit 7.7.7 Estimated Year-wise Vilmorin & Cie Revenue Growth from 2016-17to 2020-21(in %) 
Exhibit 7.7.8 Major Products of Vilmorin & Cie
Exhibit 7.7.9 SWOT Analysis of Vilmorin & Cie 
Exhibit 7.8.1 Company Profile – Land O’ Lakes                   
Exhibit 7.8.2 Contact Details – Land O’ Lakes 
Exhibit 7.8.3 Land O’ Lakes in Seed Industry Value Chain 
Exhibit 7.8.4 Land O’ Lakes from 2011-12 to 2015-16 (in Million dollars) 
Exhibit 7.8.5 Year-wise Land O’ Lakes Revenue Growth from 2011-12 to 2015-16 (in %) 
Exhibit 7.8.6 Estimated Land O’ Lakes in Revenue from 2016-17 to 2020-21 (in million dollars)
Exhibit 7.8.7 Estimated Year-wise Land O’ Lakes Revenue Growth from 2016-17to 2020-21(in %)
Exhibit 7.8.8 Major Products of Land O’ Lakes 
Exhibit 7.8.9 SWOT Analysis of Land O’ Lakes 
Exhibit 7.9.1 Company Profile – KWS SAAT SE                   
Exhibit 7.9.2 Contact Details – KWS SAAT SE 
Exhibit 7.9.3 KWS SAAT SE in Seed Industry Value Chain
Exhibit 7.9.4 KWS SAAT SE from 2011-12 to 2015-16 (in Million dollars) 
Exhibit 7.9.5 Year-wise KWS SAAT SE Revenue Growth from 2011-12 to 2015-16 (in %)
Exhibit 7.9.6 Estimated KWS SAAT SE in Revenue from 2016-17 to 2020-21 (in million dollars)
Exhibit 7.9.7 Estimated Year-wise KWS SAAT SE Growth from 2016-17to 2020-21(in %)
Exhibit 7.9.8 Major Products of KWS SAAT SE 
Exhibit 7.9.9 SWOT Analysis of KWS SAAT SE 
Exhibit 7.10.1 Company Profile – Bayer Crop Science 
Exhibit 7.10.2 Contact Details – Bayer Crop Science
Exhibit 7.10.3 Bayer Crop Science in Seed Industry Value Chain               
Exhibit 7.10.4 Bayer Crop Science from 2011-12 to 2015-16 (in Million dollars)
Exhibit 7.10.5 Year-wise Bayer Crop Science Revenue Growth from 2011-12 to 2015-16 (in %)
Exhibit 7.10.6 Estimated Bayer Crop Science in Revenue from 2016-17 to 2020-21 (in million dollar)
Exhibit 7.10.7 Estimated Year-wise Bayer Crop Science Revenue Growth from 2016-17to 2021(%)
Exhibit 7.10.8 Major Products of Bayer Crop Science
Exhibit 7.10.9 SWOT Analysis of Bayer Crop Science 
Exhibit 7.11.1 Company Profile – Sakata Seed Corporation 
Exhibit 7.11.2 Contact Details – Sakata Seed Corporation
Exhibit 7.11.3 S and W Seed Co in Sakata Seed Corporation 
Exhibit 7.11.4 Sakata Seed Corporation from 2011-12 to 2015-16 (in Million dollars)
Exhibit 7.11.5 Year-wise Sakata Seed Corporation Revenue Growth from 2011-12 to 2015-16 (in %) 
Exhibit 7.11.6 Estimated Sakata Seed Corporation in Revenue from 2016-17 to 2020-21(million dollar)
Exhibit 7.11.7 Estimated Year-wise Sakata Seed Corporation Revenue Growth from 2016-17to 2021(in %)
Exhibit 7.11.8 Major Products of Sakata Seed Corporation Limited
Exhibit 7.11.9 SWOT Analysis of Sakata Seed Corporation  
Exhibit 7.12.1 Company Profile – DLF Trifolium                  
Exhibit 7.12.2 Contact Details – DLF Trifolium  
Exhibit 7.12.3 DLF Trifolium in Seed Industry Value Chain               
Exhibit 7.12.4 DLF Trifolium from 2011-12 to 2015-16 (in Million dollars)
Exhibit 7.12.5 Year-wise DLF Trifolium Revenue Growth from 2011-12 to 2015-16 (in %) 
Exhibit 7.12.6 Estimated DLF Trifolium in Revenue from 2016-17 to 2020-21 (in million dollars) 
Exhibit 7.12.7 Estimated Year-wise DLF Trifolium Revenue Growth from 2016-17to 2020-21(in %)
Exhibit 7.12.8 Major Products of DLF Trifolium 
Exhibit 7.12.9 SWOT Analysis of DLF Trifolium   
Exhibit 8.1 Competitive Landscape 
Exhibit 10.2 Porters Five Forces 
Exhibit 10.3 SWOT analysis of global Seed industry 
  1. Advanta seeds (India)
  2. S&W Seeds (US)
  3. Syngenta (Switzerland)
  4. Monsanto (US)
  5. DuPont (US)
  6. Monsanto (US)
  7. Vilmorin & Cie (France)
  8. Land O’ Lakes (US)
  9. KWS SAAT SE (Germany)
  10. Bayer CropScience (Germany)
  11. Sakata Seed Corporation (Japan)
  12. DLF-Trifolium

Single User License (PDF)

  • This license allows for use of a publication by one person.
  • This person may print out a single copy of the publication.
  • This person can include information given in the publication in presentations and internal reports by providing full copyright credit to the publisher.
  • This person cannot share the publication (or any information contained therein) with any other person or persons.
  • Unless a Enterprise License is purchased, a Single User License must be purchased for every person that wishes to use the publication within the same organization.
  • Customers who infringe these license terms are liable for a Enterprise license fee.


Site License (PDF)*

  • This license allows for use of a publication by all users within one corporate location, e.g. a regional office.
  • These users may print out a single copy of the publication.
  • These users can include information given in the publication in presentations and internal reports by providing full copyright credit to the publisher.
  • These users cannot share the publication (or any information contained therein) with any other person or persons outside the corporate location for which the publication is purchased.
  • Unless a Enterprise License is purchased, a Site User License must be purchased for every corporate location by an organization that wishes to use the publication within the same organization.
  • Customers who infringe these license terms are liable for a Enterprise license fee.


Enterprise License (PDF)*

  • This license allows for use of a publication by unlimited users within the purchasing organization e.g. all employees of a single company.
  • Each of these people may use the publication on any computer, and may print out the report, but may not share the publication (or any information contained therein) with any other person or persons outside of the organization.
  • These employees of purchasing organization can include information given in the publication in presentations and internal reports by providing full copyright credit to the publisher.

*If Applicable.

About Us

NAVADHI is a market research company that helps global firms differentiate themselves, break market entry barriers, track their investments, develop business strategies and plan for future by providing actionable market research intelligence that helps them succeed.

Infomation

  • About Us
  • Publications
  • FAQs
  • Privacy Policy
  • Terms & Conditions
  • Careers
  • Press Releases
  • Contact

Source URL:https://www.navadhi.com/publications/global-seed-market-research-report-2021-crop-type-treatment-and-geography

Links
[1] https://www.navadhi.com/countries/global