
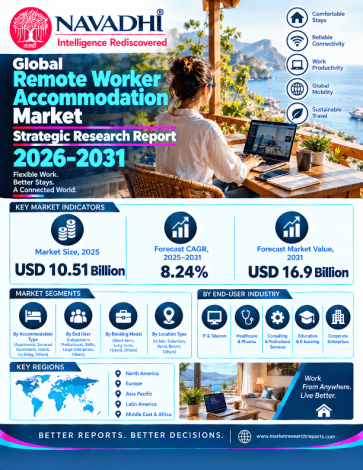

Remote worker accommodation is the paid housing that remote and hybrid professionals use while working away from their primary residence, from a week to several months. Demand comes from independent digital nomads, employees on work-from-anywhere programmes, project and contract professionals, and researchers on assignment. A 2025 survey of US independent workers (MBO Partners) counted 18.5 million digital nomads, about 12% of the US workforce, staying 6.4 weeks per location on average, up from 5.4 weeks in 2023; 64 countries now offer digital nomad visas.
The global remote worker accommodation market is estimated at about USD 10,506 million in 2025 and is projected to reach about USD 16,899 million by 2031, a compound annual growth rate (CAGR) of 8.3% over 2026-2031. North America is the largest region at 42% of 2025 value and Europe follows at 29%; Asia Pacific is the fastest-growing region at 9.7% a year, led by Japan, Thailand and China. A bear case reaches about USD 14,441 million and a bull case about USD 19,695 million in 2031.
The market is segmented by accommodation type into coliving spaces, extended-stay hotels, serviced apartments and work-ready short-term rentals; by application into digital nomad villages and retreats, corporate housing and independent remote worker stays; and by the industry of the remote worker into information technology, professional services, media and creative, financial services, education, healthcare and others. Information technology and software accounts for the largest share of demand at about 32% in 2025, while healthcare and life sciences is the fastest-growing industry. The report profiles ten companies, includes Porter's Five Forces, PESTLE and SWOT analyses and an outlook to 2031, and is value-based only.
Scope of the Global Remote Worker Accommodation Market Strategic Research Report 2026-2031
This report provides market sizing in value (USD million) and 2026–2031 forecasts, with 2025 as the base year, by accommodation type, application, region and country. It includes a regional outlook across 5 regions and 40 country lines, growth drivers and restraints, a competitive landscape, Porter's Five Forces, PESTLE and SWOT analysis, future trends, and profiles of 10 key companies.
Segment by Type
Segment by Application
Key Companies Profiled
Airbnb, Inc., Marriott International, Inc., Hilton Worldwide Holdings Inc., Extended Stay America, The Ascott Limited, Frasers Hospitality, Blueground, Habyt Group, Outsite, Anyplace.
Who Can Use This Report?
Accommodation operators and investors in coliving, extended-stay and serviced apartments; hotel groups and platforms planning mid-term stay products; employers and mobility teams designing remote-work and relocation policies; destination and visa policymakers; and consultants who need a defined, sourced market view by region and industry.
| 1. Executive Summary 1.1 Market Definition and Scope 1.2 Market Size and Growth Trajectory 1.3 Key Growth Drivers 1.4 Segment and Application Highlights 1.5 Regional Highlights 1.6 Competitive Landscape and Corporate Developments 1.7 Principal Risks 1.8 Outlook 2. Industry Overview & Forecast 2.1.1 Market Definition and Scope 2.1.2 Market Size and Historical Performance 2.1.3 Forecast Trajectory and Year-by-Year Growth Logic 2.1.4 Volume Analysis and Demand Characteristics 2.1.5 Value Chain Structure and Pricing Dynamics 3. Market Segmentation by Type 3.1 Overview of the Type Segmentation Framework 3.1.1 Work-Ready Short-Term Rentals 3.1.2 Serviced Apartments 3.1.3 Extended-Stay Hotels 3.1.4 Coliving Spaces 3.2 Comparative Analysis and Mix Shift 4. Market Segmentation by Application 4.1 Overview of the Application Framework 4.1.1 Digital Nomad Villages and Retreats 4.1.2 Corporate Housing 4.1.3 Independent Remote Worker Stays 4.2 Comparative Assessment of Application Segments 5. Regional Market Forecast 5.1 North America 5.1.1 Regional Overview 5.1.2 Key Growth Drivers 5.1.3 Regulatory & Infrastructure Landscape 5.1.4 Country-Level Analysis 5.1.5 Market Forecast 2025–2031 5.2 Europe 5.2.1 Regional Overview 5.2.2 Key Growth Drivers 5.2.3 Regulatory & Infrastructure Landscape 5.2.4 Country-Level Analysis 5.2.5 Market Forecast 2025–2031 5.3 Asia Pacific 5.3.1 Regional Overview 5.3.2 Key Growth Drivers 5.3.3 Regulatory & Infrastructure Landscape 5.3.4 Country-Level Analysis 5.3.5 Market Forecast 2025–2031 5.4 Middle East and Africa 5.4.1 Regional Overview 5.4.2 Key Growth Drivers 5.4.3 Regulatory & Infrastructure Landscape 5.4.4 Country-Level Analysis 5.4.5 Market Forecast 2025–2031 5.5 Latin America 5.5.1 Regional Overview 5.5.2 Key Growth Drivers 5.5.3 Regulatory & Infrastructure Landscape 5.5.4 Country-Level Analysis 5.5.5 Market Forecast 2025–2031 6. Country-Level Market Forecast 6.1 North America 6.1.1 United States 6.1.2 Canada 6.1.3 Mexico 6.1.4 Rest of North America 6.2 Europe 6.2.1 United Kingdom 6.2.2 Spain 6.2.3 Germany 6.2.4 France 6.2.5 Portugal 6.2.6 Italy 6.2.7 Netherlands 6.2.8 Greece 6.2.9 Switzerland 6.2.10 Rest of Europe 6.3 Asia Pacific 6.3.1 Japan 6.3.2 China 6.3.3 Thailand 6.3.4 Indonesia 6.3.5 Australia 6.3.6 South Korea 6.3.7 Singapore 6.3.8 India 6.3.9 Vietnam 6.3.10 Malaysia 6.3.11 Rest of Asia Pacific 6.4 Middle East and Africa 6.4.1 United Arab Emirates 6.4.2 South Africa 6.4.3 Turkey 6.4.4 Saudi Arabia 6.4.5 Morocco 6.4.6 Egypt 6.4.7 Israel 6.4.8 Rest of Middle East and Africa 6.5 Latin America 6.5.1 Brazil 6.5.2 Colombia 6.5.3 Argentina 6.5.4 Costa Rica 6.5.5 Chile 6.5.6 Panama 6.5.7 Rest of Latin America 7. Growth Drivers & Inhibitors 7.1 Growth Drivers 7.1.1 Structural Normalisation of Location-Independent Work Arrangements 7.1.2 Proliferation of Remote-Work Visa Programmes Across 64 Jurisdictions 7.1.3 Regulatory Displacement of Short-Term Rental Supply Toward Formal Mid-Term Formats 7.1.4 Corporate Mobility and Institutional Demand Channels 7.1.5 Institutional Capital Formation and Supply Pipeline Expansion 7.1.6 Conversion of Underutilised Commercial Real Estate Assets 7.2 Restraints 7.2.1 Regulatory Fragmentation Across Tenancy and Zoning Regimes 7.2.2 Thin Operating Margins and Structural Vulnerability of Leased-Asset Models 7.2.3 Return-to-Office Mandates Compressing Employer-Sponsored Demand 7.2.4 Informational Opacity and Absence of Audited Market Data 7.2.5 Tax Residency Thresholds and Social Security Complexity 7.3 Integrated Impact Assessment 8. Key Company Profiles 8.1 Airbnb, Inc. 8.1.1 Company Overview 8.1.2 Key Products & Segments 8.1.3 Financial Performance (2023–2025) 8.1.4 Business Strategy 8.1.5 SWOT Analysis 8.1.6 Strategic Implications (2025–2031) 8.2 Marriott International, Inc. 8.2.1 Company Overview 8.2.2 Key Products & Segments 8.2.3 Financial Performance (2023–2025) 8.2.4 Business Strategy 8.2.5 SWOT Analysis 8.2.6 Strategic Implications (2025–2031) 8.3 Hilton Worldwide Holdings Inc. 8.3.1 Company Overview 8.3.2 Key Products & Segments 8.3.3 Financial Performance (2023–2025) 8.3.4 Business Strategy 8.3.5 SWOT Analysis 8.3.6 Strategic Implications (2025–2031) 8.4 Extended Stay America 8.4.1 Company Overview 8.4.2 Key Products & Segments 8.4.3 Financial Performance (2023–2025) 8.4.4 Business Strategy 8.4.5 SWOT Analysis 8.4.6 Strategic Implications (2025–2031) 8.5 The Ascott Limited 8.5.1 Company Overview 8.5.2 Key Products & Segments 8.5.3 Financial Performance (2023–2025) 8.5.4 Business Strategy 8.5.5 SWOT Analysis 8.5.6 Strategic Implications (2025–2031) 8.6 Frasers Hospitality 8.6.1 Company Overview 8.6.2 Key Products & Segments 8.6.3 Financial Performance (2023–2025) 8.6.4 Business Strategy 8.6.5 SWOT Analysis 8.6.6 Strategic Implications (2025–2031) 8.7 Blueground 8.7.1 Company Overview 8.7.2 Key Products & Segments 8.7.3 Financial Performance (2023–2025) 8.7.4 Business Strategy 8.7.5 SWOT Analysis 8.7.6 Strategic Implications (2025–2031) 8.8 Habyt Group 8.8.1 Company Overview 8.8.2 Key Products & Segments 8.8.3 Financial Performance (2023–2025) 8.8.4 Business Strategy 8.8.5 SWOT Analysis 8.8.6 Strategic Implications (2025–2031) 8.9 Outsite 8.9.1 Company Overview 8.9.2 Key Products & Segments 8.9.3 Financial Performance (2023–2025) 8.9.4 Business Strategy 8.9.5 SWOT Analysis 8.9.6 Strategic Implications (2025–2031) 8.10 Anyplace 8.10.1 Company Overview 8.10.2 Key Products & Segments 8.10.3 Financial Performance (2023–2025) 8.10.4 Business Strategy 8.10.5 SWOT Analysis 8.10.6 Strategic Implications (2025–2031) 9. Competitive Landscape 9.1 Competitive Landscape Overview 9.1.1 Leading Operators in the Remote Worker Accommodation Market, 2025 9.2 Competitive Intensity Assessment 9.2.1 Tier Classification and Revenue Ranges 9.2.2 Capacity versus Demand Dynamics 9.2.3 Pricing Environment: Premium, Value, and Commoditised Layers 9.2.4 Barriers to Entry and Exit 9.2.5 Overall Competitive Intensity Assessment 9.3 Key Player Strategies & Positioning 9.3.1 Strategic Group Mapping 9.3.2 Differentiation Strategies 9.3.3 Geographic Strongholds 9.3.4 M&A and Partnership Activity, 2022–Present 9.3.5 R&D and Technology Investment Trends 9.4 Competitive Dynamics & Strategic Outlook 9.4.1 The Evolving Threat Landscape: New Entrants and Adjacent Players 9.4.2 Consolidation vs. Fragmentation Outlook 9.4.3 Competitive Response Matrix 9.4.4 Strategic Recommendations for 2025–2031 10. Porter's Five Forces Analysis 10.1 Threat of New Entrants 10.2 Bargaining Power of Buyers 10.3 Bargaining Power of Suppliers 10.4 Threat of Substitutes 10.5 Competitive Rivalry 11. PESTLE Analysis 11.1 Overview and Analytical Framework 11.2 Political 11.3 Economic 11.4 Sociological 11.5 Technological 11.6 Legal 11.7 Environmental 11.8 PESTLE Summary Table 12. SWOT Analysis 12.1.1 Detailed Analysis 12.1.2 Strengths 12.1.3 Weaknesses 12.1.4 Opportunities 12.1.5 Threats 12.1.6 Strategic Implications and Priority Actions 13. Future Trends & Outlook 13.1 Overview of the Trend Landscape 13.2 Trend Analyses 13.2.1 Structural Lengthening of Average Stay Duration 13.2.2 Proliferation and Deepening of Remote-Work Visa Infrastructure 13.2.3 Regulatory Formalisation Redirecting Supply Toward Mid-Term and Serviced Formats 13.2.4 Institutional Capital Entry and Supply Pipeline Expansion 13.2.5 Life Sciences and Healthcare Emerging as the Fastest-Growing Demand Vertical 13.2.6 Technology-Enabled Stay Matching, Dynamic Pricing, and AI Integration 13.2.7 Conversion of Underperforming Real Estate Assets into Extended-Stay Supply 13.2.8 Tenancy Law and Tax Residency Compliance as a Market Structuring Force 13.3 Summary Trend Table 13.4 Forward Outlook to 2031 List of Exhibits Exhibit 2.1: Forecast of Global Market YoY Growth Rate & CAGR Summary (in %) Exhibit 2.2: Forecast of Global (in USD Bn) Exhibit 2.3: Forecast of North America (in USD Bn) Exhibit 2.4: Forecast of Europe (in USD Bn) Exhibit 2.5: Forecast of Asia Pacific (in USD Bn) Exhibit 2.6: Forecast of Middle East and Africa (in USD Bn) Exhibit 2.7: Forecast of Latin America (in USD Bn) Exhibit 3.8: Forecast of Coliving Spaces (in USD Bn) Exhibit 3.9: Forecast of Extended-Stay Hotels (in USD Bn) Exhibit 3.10: Forecast of Serviced Apartments (in USD Bn) Exhibit 3.11: Forecast of Work-Ready Short-Term Rentals (in USD Bn) Exhibit 4.12: Forecast of Digital Nomad Villages and Retreats (in USD Bn) Exhibit 4.13: Forecast of Corporate Housing (in USD Bn) Exhibit 4.14: Forecast of Independent Remote Worker Stays (in USD Bn) Exhibit 6.15: Forecast of North America (in USD Bn) Exhibit 6.16: Forecast of United States (in USD Bn) Exhibit 6.17: Forecast of Canada (in USD Bn) Exhibit 6.18: Forecast of Mexico (in USD Bn) Exhibit 6.19: Forecast of Rest of North America (in USD Bn) Exhibit 6.20: Forecast of Europe (in USD Bn) Exhibit 6.21: Forecast of United Kingdom (in USD Bn) Exhibit 6.22: Forecast of Spain (in USD Bn) Exhibit 6.23: Forecast of Germany (in USD Bn) Exhibit 6.24: Forecast of France (in USD Bn) Exhibit 6.25: Forecast of Portugal (in USD Bn) Exhibit 6.26: Forecast of Italy (in USD Bn) Exhibit 6.27: Forecast of Netherlands (in USD Bn) Exhibit 6.28: Forecast of Greece (in USD Bn) Exhibit 6.29: Forecast of Switzerland (in USD Bn) Exhibit 6.30: Forecast of Rest of Europe (in USD Bn) Exhibit 6.31: Forecast of Asia Pacific (in USD Bn) Exhibit 6.32: Forecast of Japan (in USD Bn) Exhibit 6.33: Forecast of China (in USD Bn) Exhibit 6.34: Forecast of Thailand (in USD Bn) Exhibit 6.35: Forecast of Indonesia (in USD Bn) Exhibit 6.36: Forecast of Australia (in USD Bn) Exhibit 6.37: Forecast of South Korea (in USD Bn) Exhibit 6.38: Forecast of Singapore (in USD Bn) Exhibit 6.39: Forecast of India (in USD Bn) Exhibit 6.40: Forecast of Vietnam (in USD Bn) Exhibit 6.41: Forecast of Malaysia (in USD Bn) Exhibit 6.42: Forecast of Rest of Asia Pacific (in USD Bn) Exhibit 6.43: Forecast of Middle East and Africa (in USD Bn) Exhibit 6.44: Forecast of United Arab Emirates (in USD Bn) Exhibit 6.45: Forecast of South Africa (in USD Bn) Exhibit 6.46: Forecast of Turkey (in USD Bn) Exhibit 6.47: Forecast of Saudi Arabia (in USD Bn) Exhibit 6.48: Forecast of Morocco (in USD Bn) Exhibit 6.49: Forecast of Egypt (in USD Bn) Exhibit 6.50: Forecast of Rest of Middle East and Africa (in USD Bn) Exhibit 6.51: Forecast of Latin America (in USD Bn) Exhibit 6.52: Forecast of Brazil (in USD Bn) Exhibit 6.53: Forecast of Colombia (in USD Bn) Exhibit 6.54: Forecast of Argentina (in USD Bn) Exhibit 6.55: Forecast of Costa Rica (in USD Bn) Exhibit 6.56: Forecast of Chile (in USD Bn) Exhibit 6.57: Forecast of Panama (in USD Bn) Exhibit 6.58: Forecast of Rest of Latin America (in USD Bn) |
*If Applicable.

NAVADHI is a market research company that helps global firms differentiate themselves, break market entry barriers, track their investments, develop business strategies and plan for future by providing actionable market research intelligence that helps them succeed.