
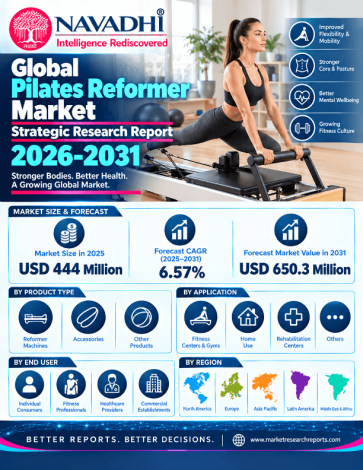

The global Pilates reformer market is valued at approximately USD 444.0 million in 2025 and is projected to reach about USD 650.3 million by 2031, a compound annual growth rate of 6.6% over 2025-2031. Shipments are estimated at about 219.5 thousand units in 2025, rising to about 343.1 thousand units by 2031, a volume CAGR of 7.7%. North America is the largest region at about USD 157.6 million (35.5% of 2025 value), and Asia Pacific is the fastest-growing region at about 9.5% a year.
Standard reformers account for 90% of 2025 value (USD 399.6 million), while smart reformers, at 10% of value (USD 44.4 million), are the fastest-growing type at about 16.4% a year. By application, home fitness is the largest at about USD 209.6 million (47.2%) and the fastest-growing at 7.4% a year, followed by Pilates studios (USD 131.7 million), other commercial settings (gyms, clubs, hotels and corporate, USD 70.3 million) and rehabilitation clinics (USD 32.4 million). Bear and bull scenario CAGRs are 4.6% and 8.6%.
The 2025 base combines a bottom-up build (units by channel multiplied by average selling prices) with a top-down cross-check from published estimates, and the report states the basis and the weakest inputs. Nine companies are profiled, including Merrithew, Balanced Body, Xponential Fitness (Club Pilates), Technogym, BASI Systems, Elina Pilates, Stamina Products, Flexia and Your Reformer. Most do not disclose reformer revenue, and revenue is shown only where a named source reports it.
Scope of the Global Pilates Reformer Market Strategic Research Report 2026-2031
This report provides market value and volume forecasts for 2022-2031 (base year 2025, forecast 2026-2031) by type, application, region and 27 country lines, together with company profiles, competitive landscape, Porter's Five Forces, PESTLE and SWOT analysis, and future trends and outlook.
Segment by Type
Segment by Application
Who Can Use This Report?
Reformer and studio-equipment makers, fitness franchisors and studio operators, gym and hotel operators, distributors and retailers, investors, and consultants sizing the Pilates equipment market or planning market entry.
| 1. Executive Summary 1.1 Market Definition and Size 1.2 Principal Growth Drivers 1.3 Segmentation Highlights 1.3.1 By Type 1.3.2 By Application 1.4 Regional and Country Highlights 1.4.1 By Region 1.5 Competitive Structure and Key Strategic Developments 1.6 Principal Risks and Inhibitors 1.7 Outlook 2. Industry Overview & Forecast 2.1.1 Market Definition and Scope 2.1.2 Market Size and Historical Performance 2.1.3 Forecast Logic and Growth Drivers 2.1.4 Volume Analysis 2.1.5 Value-Chain and Pricing Dynamics 3. Market Segmentation by Type 3.1 Overview of the Type Segmentation Framework 3.2 Standard Reformer 3.2.1 Definition and Applications 3.2.2 Value, Share, and Forecast 3.2.3 Demand Drivers 3.2.4 Technology and Pricing Dynamics 3.2.5 Key Suppliers and Competitive Structure 3.2.6 Risks 3.3 Smart Reformer 3.3.1 Definition and Applications 3.3.2 Value, Share, and Forecast 3.3.3 Demand Drivers 3.3.4 Technology and Pricing Dynamics 3.3.5 Key Suppliers and Competitive Structure 3.3.6 Risks 3.4 Volume Analysis 3.4.1 Global Reformer Volume: 2022–2031 3.5 Type Mix Shift: Implications for Market Structure 4. Market Segmentation by Application 4.1 Overview of the Application Segmentation Framework 4.2 Pilates Studios 4.2.1 Segment Definition and Market Position 4.2.2 Growth Trajectory and CAGR 4.2.3 Buyer Behaviour and Procurement Patterns 4.2.4 Risks 4.3 Home Fitness 4.3.1 Segment Definition and Market Position 4.3.2 Growth Trajectory and CAGR 4.3.3 Buyer Behaviour and Procurement Patterns 4.3.4 Risks 4.4 Rehabilitation Clinics 4.4.1 Segment Definition and Market Position 4.4.2 Growth Trajectory and CAGR 4.4.3 Buyer Behaviour and Procurement Patterns 4.4.4 Risks 4.5 Others (Gyms, Clubs, Hotels, Corporate) 4.5.1 Segment Definition and Market Position 4.5.2 Growth Trajectory and CAGR 4.5.3 Buyer Behaviour and Procurement Patterns 4.5.4 Risks 4.6 Comparative Segment Analysis 5. Regional Market Forecast 5.1 North America 5.1.1 Regional Overview 5.1.2 Key Growth Drivers 5.1.3 Regulatory & Infrastructure Landscape 5.1.4 Country-Level Analysis 5.1.5 Market Forecast 2025–2031 5.2 Europe 5.2.1 Regional Overview 5.2.2 Key Growth Drivers 5.2.3 Regulatory & Infrastructure Landscape 5.2.4 Country-Level Analysis 5.2.5 Market Forecast 2025–2031 5.3 Asia Pacific 5.3.1 Regional Overview 5.3.2 Key Growth Drivers 5.3.3 Regulatory & Infrastructure Landscape 5.3.4 Country-Level Analysis 5.3.5 Market Forecast 2025–2031 5.4 Latin America 5.4.1 Regional Overview 5.4.2 Key Growth Drivers 5.4.3 Regulatory & Infrastructure Landscape 5.4.4 Country-Level Analysis 5.4.5 Market Forecast 2025–2031 5.5 Middle East and Africa 5.5.1 Regional Overview 5.5.2 Key Growth Drivers 5.5.3 Regulatory & Infrastructure Landscape 5.5.4 Country-Level Analysis 5.5.5 Market Forecast 2025–2031 6. Country-Level Market Forecast 6.1 North America 6.1.1 United States 6.1.2 Canada 6.1.3 Mexico 6.1.4 Rest of North America 6.2 Europe 6.2.1 Germany 6.2.2 United Kingdom 6.2.3 France 6.2.4 Italy 6.2.5 Spain 6.2.6 Netherlands 6.2.7 Rest of Europe 6.3 Asia Pacific 6.3.1 China 6.3.2 Japan 6.3.3 Australia 6.3.4 India 6.3.5 South Korea 6.3.6 Rest of Asia Pacific 6.4 Latin America 6.4.1 Brazil 6.4.2 Argentina 6.4.3 Chile 6.4.4 Colombia 6.4.5 Rest of Latin America 6.5 Middle East and Africa 6.5.1 GCC Countries 6.5.2 South Africa 6.5.3 Turkey 6.5.4 Israel 6.5.5 Rest of Middle East and Africa 7. Growth Drivers & Inhibitors 7.1 Growth Drivers 7.1.1 Secular Expansion of the Global Wellness Economy and Preventive Health Consciousness 7.1.2 Rapid Studio Network Proliferation Driving Commercial Equipment Demand 7.1.3 Smart Reformer Innovation Elevating Average Selling Prices and Addressable Value 7.1.4 Corporate Strategic Actions Accelerating Market Consolidation and Distribution Breadth 7.1.5 Home Fitness Channel Maturation and Direct-to-Consumer Pricing Innovation 7.1.6 Asia Pacific Market Emergence as a Structural Growth Catalyst 7.2 Market Restraints and Inhibitors 7.2.1 Elevated Unit Price Points Constraining Addressable Consumer and Operator Populations 7.2.2 Limited Physical Footprint and Storage Constraints Suppressing Home Segment Conversion Rates 7.2.3 Competitive Intensity from Adjacent Fitness Modalities and Subscription-Based Digital Platforms 7.2.4 Supply Chain Concentration and Input Cost Volatility 7.2.5 Skilled Instructor Scarcity as a Limiting Factor on Studio Expansion Velocity 7.3 Impact Assessment Summary 7.4 Integrated Assessment 8. Key Company Profiles 8.1 Merrithew Corp 8.1.1 Company Overview 8.1.2 Key Products & Segments 8.1.3 Financial Performance (2023–2025) 8.1.4 Business Strategy 8.1.5 SWOT Analysis 8.1.6 Strategic Implications (2025–2031) 8.2 Balanced Body 8.2.1 Company Overview 8.2.2 Key Products & Segments 8.2.3 Financial Performance (2023–2025) 8.2.4 Business Strategy 8.2.5 SWOT Analysis 8.2.6 Strategic Implications (2025–2031) 8.3 Xponential Fitness 8.3.1 Company Overview 8.3.2 Key Products & Segments 8.3.3 Financial Performance (2023–2025) 8.3.4 Business Strategy 8.3.5 SWOT Analysis 8.3.6 Strategic Implications (2025–2031) 8.4 Technogym S.p.A. 8.4.1 Company Overview 8.4.2 Key Products & Segments 8.4.3 Financial Performance (2023–2025) 8.4.4 Business Strategy 8.4.5 SWOT Analysis 8.4.6 Strategic Implications (2025–2031) 8.5 BASI Systems 8.5.1 Company Overview 8.5.2 Key Products & Segments 8.5.3 Financial Performance (2023–2025) 8.5.4 Business Strategy 8.5.5 SWOT Analysis 8.5.6 Strategic Implications (2025–2031) 8.6 Elina Pilates 8.6.1 Company Overview 8.6.2 Key Products & Segments 8.6.3 Financial Performance (2023–2025) 8.6.4 Business Strategy 8.6.5 SWOT Analysis 8.6.6 Strategic Implications (2025–2031) 8.7 Stamina Products 8.7.1 Company Overview 8.7.2 Key Products & Segments 8.7.3 Financial Performance (2023–2025) 8.7.4 Business Strategy 8.7.5 SWOT Analysis 8.7.6 Strategic Implications (2025–2031) 8.8 Flexia 8.8.1 Company Overview 8.8.2 Key Products & Segments 8.8.3 Financial Performance (2023–2025) 8.8.4 Business Strategy 8.8.5 SWOT Analysis 8.8.6 Strategic Implications (2025–2031) 8.9 Your Reformer 8.9.1 Company Overview 8.9.2 Key Products & Segments 8.9.3 Financial Performance (2023–2025) 8.9.4 Business Strategy 8.9.5 SWOT Analysis 8.9.6 Strategic Implications (2025–2031) 9. Competitive Landscape 9.1 Competitive Landscape Overview 9.1.1 Market Concentration: Estimated Share of Top Players 9.1.2 Herfindahl-Hirschman Index and Concentration Metric 9.1.3 Competitive Dynamics by Player Type 9.1.4 Overall Competitive Intensity Rating 9.2 Competitive Intensity Assessment 9.2.1 Player Tier Breakdown 9.2.2 Tier 1: Established Multi-Channel Incumbents 9.2.3 Tier 2: Specialist and Direct-to-Consumer Players 9.2.4 Tier 3: Mass-Market and Volume Players 9.2.5 Capacity vs Demand Dynamics 9.2.6 Pricing Environment 9.2.7 Barriers to Entry and Exit 9.3 Key Player Strategies & Positioning 9.3.1 Strategic Group Map Narrative 9.3.2 Differentiation Strategies Across Major Players 9.3.3 Geographic Strongholds 9.3.4 M&A and Partnership Activity (2022–Present) 9.3.5 R&D and Technology Investment Trends 9.4 Competitive Dynamics & Strategic Outlook 9.4.1 Overview of the Competitive Landscape in Transition 9.4.2 Emerging Competitive Threats 9.4.2.1 New Entrants and Adjacent Players 9.4.2.2 Digital Disruptors and Smart-Reformer Challengers 9.4.3 Consolidation vs Fragmentation Outlook 9.4.4 Competitive Response Matrix 9.4.5 Strategic Recommendations for 2025–2031 9.4.6 Conclusion 10. Porter's Five Forces Analysis 10.1 Threat of New Entrants 10.2 Bargaining Power of Buyers 10.3 Bargaining Power of Suppliers 10.4 Threat of Substitutes 10.5 Competitive Rivalry 11. PESTLE Analysis 11.1 Overview and Analytical Framework 11.2 Political 11.3 Economic 11.4 Social 11.5 Technological 11.6 Legal 11.7 Environmental 11.8 PESTLE Summary Assessment Table 12. SWOT Analysis 12.1 Industry SWOT Analysis 12.1.1 Detailed Analysis 12.1.1.1 Strengths 12.1.1.2 Weaknesses 12.1.1.3 Opportunities 12.1.1.4 Threats 12.1.2 Strategic Implications 13. Future Trends & Outlook 13.1 Trend Analysis 13.1.1 Smart Reformer Technology Adoption Accelerates 13.1.2 Home Fitness Remains the Dominant and Fastest-Growing Application Segment 13.1.3 Asia Pacific Emerges as the Highest-Growth Regional Market 13.1.4 Institutional Channel Expansion Through Gym and Hospitality Integration 13.1.5 Boutique Studio Network Expansion Sustains Professional Equipment Demand 13.1.6 Rehabilitation and Clinical Adoption Broadens the Addressable Market 13.1.7 Strategic M&A and Portfolio Consolidation Intensifies 13.1.8 Premiumisation and Price Stratification Create Multi-Tier Competition 13.2 Trend Summary Table 13.3 Forward Outlook List of Exhibits Exhibit 2.1: Forecast of Global Market YoY Growth Rate & CAGR Summary (in %) Exhibit 2.2: Forecast of Global Market YoY Growth Rate & CAGR Summary (in %) Exhibit 2.3: Forecast of Global (in USD Mn) Exhibit 2.4: Forecast of North America (in USD Mn) Exhibit 2.5: Forecast of Europe (in USD Mn) Exhibit 2.6: Forecast of Asia Pacific (in USD Mn) Exhibit 2.7: Forecast of Latin America (in USD Mn) Exhibit 2.8: Forecast of Middle East and Africa (in USD Mn) Exhibit 2.9: Forecast of Global (in k units) Exhibit 2.10: Forecast of North America (in k units) Exhibit 2.11: Forecast of Europe (in k units) Exhibit 2.12: Forecast of Asia Pacific (in k units) Exhibit 2.13: Forecast of Latin America (in k units) Exhibit 2.14: Forecast of Middle East and Africa (in k units) Exhibit 3.15: Forecast of Standard Reformer (in USD Mn) Exhibit 3.16: Forecast of Standard Reformer (in k units) Exhibit 3.17: Forecast of Smart Reformer (in USD Mn) Exhibit 3.18: Forecast of Smart Reformer (in k units) Exhibit 4.19: Forecast of Pilates Studios (in USD Mn) Exhibit 4.20: Forecast of Pilates Studios (in k units) Exhibit 4.21: Forecast of Home Fitness (in USD Mn) Exhibit 4.22: Forecast of Home Fitness (in k units) Exhibit 4.23: Forecast of Rehabilitation Clinics (in USD Mn) Exhibit 4.24: Forecast of Rehabilitation Clinics (in k units) Exhibit 4.25: Forecast of Others (gyms, clubs, hotels, corporate) (in USD Mn) Exhibit 4.26: Forecast of Others (gyms, clubs, hotels, corporate) (in k units) Exhibit 6.27: Forecast of North America (in USD Mn) Exhibit 6.28: Forecast of United States (in USD Mn) Exhibit 6.29: Forecast of Canada (in USD Mn) Exhibit 6.30: Forecast of Mexico (in USD Mn) Exhibit 6.31: Forecast of Rest of North America (in USD Mn) Exhibit 6.32: Forecast of North America (in k units) Exhibit 6.33: Forecast of United States (in k units) Exhibit 6.34: Forecast of Canada (in k units) Exhibit 6.35: Forecast of Mexico (in k units) Exhibit 6.36: Forecast of Rest of North America (in k units) Exhibit 6.37: Forecast of Europe (in USD Mn) Exhibit 6.38: Forecast of Germany (in USD Mn) Exhibit 6.39: Forecast of United Kingdom (in USD Mn) Exhibit 6.40: Forecast of France (in USD Mn) Exhibit 6.41: Forecast of Italy (in USD Mn) Exhibit 6.42: Forecast of Spain (in USD Mn) Exhibit 6.43: Forecast of Netherlands (in USD Mn) Exhibit 6.44: Forecast of Rest of Europe (in USD Mn) Exhibit 6.45: Forecast of Europe (in k units) Exhibit 6.46: Forecast of Germany (in k units) Exhibit 6.47: Forecast of United Kingdom (in k units) Exhibit 6.48: Forecast of France (in k units) Exhibit 6.49: Forecast of Italy (in k units) Exhibit 6.50: Forecast of Spain (in k units) Exhibit 6.51: Forecast of Netherlands (in k units) Exhibit 6.52: Forecast of Rest of Europe (in k units) Exhibit 6.53: Forecast of Asia Pacific (in USD Mn) Exhibit 6.54: Forecast of China (in USD Mn) Exhibit 6.55: Forecast of Japan (in USD Mn) Exhibit 6.56: Forecast of Australia (in USD Mn) Exhibit 6.57: Forecast of India (in USD Mn) Exhibit 6.58: Forecast of South Korea (in USD Mn) Exhibit 6.59: Forecast of Rest of Asia Pacific (in USD Mn) Exhibit 6.60: Forecast of Asia Pacific (in k units) Exhibit 6.61: Forecast of China (in k units) Exhibit 6.62: Forecast of Japan (in k units) Exhibit 6.63: Forecast of Australia (in k units) Exhibit 6.64: Forecast of India (in k units) Exhibit 6.65: Forecast of South Korea (in k units) Exhibit 6.66: Forecast of Rest of Asia Pacific (in k units) Exhibit 6.67: Forecast of Latin America (in USD Mn) Exhibit 6.68: Forecast of Brazil (in USD Mn) Exhibit 6.69: Forecast of Argentina (in USD Mn) Exhibit 6.70: Forecast of Chile (in USD Mn) Exhibit 6.71: Forecast of Colombia (in USD Mn) Exhibit 6.72: Forecast of Rest of Latin America (in USD Mn) Exhibit 6.73: Forecast of Latin America (in k units) Exhibit 6.74: Forecast of Brazil (in k units) Exhibit 6.75: Forecast of Argentina (in k units) Exhibit 6.76: Forecast of Chile (in k units) Exhibit 6.77: Forecast of Colombia (in k units) Exhibit 6.78: Forecast of Rest of Latin America (in k units) Exhibit 6.79: Forecast of Middle East and Africa (in USD Mn) Exhibit 6.80: Forecast of GCC Countries (in USD Mn) Exhibit 6.81: Forecast of South Africa (in USD Mn) Exhibit 6.82: Forecast of Turkey (in USD Mn) Exhibit 6.83: Forecast of Israel (in USD Mn) Exhibit 6.84: Forecast of Rest of Middle East and Africa (in USD Mn) Exhibit 6.85: Forecast of Middle East and Africa (in k units) Exhibit 6.86: Forecast of GCC Countries (in k units) Exhibit 6.87: Forecast of South Africa (in k units) Exhibit 6.88: Forecast of Turkey (in k units) Exhibit 6.89: Forecast of Israel (in k units) Exhibit 6.90: Forecast of Rest of Middle East and Africa (in k units) |
*If Applicable.

NAVADHI is a market research company that helps global firms differentiate themselves, break market entry barriers, track their investments, develop business strategies and plan for future by providing actionable market research intelligence that helps them succeed.