
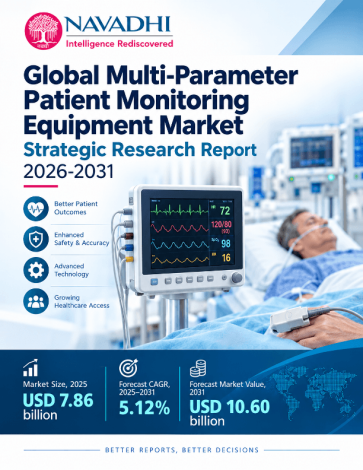

The global multi-parameter patient monitoring equipment market is valued at US$7,859.0 million in 2025 and is forecast to reach US$10,603.4 million by 2031, a compound annual growth rate (CAGR) of 5.1% over 2025-2031. Unit volume is estimated at about 2.94 million monitors in 2025, rising to about 3.98 million by 2031. Published third-party estimates for comparable scopes range from about US$5.1 billion to US$9.6 billion for 2025, because definitions and methods differ. The report states its scope and triangulates a US$7,859.0 million base from a bottom-up channel model and published market sizes.
Multi-parameter patient monitors are bedside, transport, telemetry and portable devices that continuously measure several vital signs, such as ECG, non-invasive blood pressure, SpO2, temperature, respiration and, in higher-acuity units, invasive pressures and capnography, and display, alarm on and communicate them. The scope covers high-, mid- and low-acuity monitors with their standard modules, sensors and accessories. Single-parameter devices, standalone ventilators, defibrillators, anesthesia machines, central-station software sold separately and services are excluded.
Scope of the Global Multi-Parameter Patient Monitoring Equipment Market Strategic Research Report
This report covers market value (US$ million) and unit volume (million units) for 2022-2031, with 2025 as the base year and 2026-2031 as the forecast period. It analyses acuity-based product segments and end-user segments, five regions and 23 countries, 11 profiled companies, competitive structure, Porter's Five Forces, PESTLE, SWOT and future trends. No company discloses monitor-only revenue, so the report presents verified company facts and does not state company market shares or concentration ratios. Average selling prices are model estimates.
Segment by Type
Segment by Application
Who Can Use This Report?
1. Executive Summary
1.1.1 Market Definition and Scale
1.1.2 Principal Growth Drivers
1.1.3 Market Segmentation Highlights
1.1.4 Regional and Country Highlights
1.1.5 Competitive Structure
1.1.6 Principal Risks and Restraints
1.1.7 Outlook
2. Industry Overview & Forecast
2.1 Market Definition and Scope
2.2 Market Size and Historical Performance
2.3 Forecast and Growth Logic
2.4 Volume Analysis
2.4.1 Year-by-Year Volume Trajectory
2.4.2 Price and Mix Effects
2.5 Value Chain and Pricing Architecture
3. Market Segmentation by Type
3.1 Overview of the Type Segmentation Framework
3.1.1 High-Acuity Monitors
3.1.2 Mid-Acuity Monitors
3.1.3 Low-Acuity Monitors
3.2 Volume Analysis
3.2.1 Global Unit Volume Trend, 2022–2031
3.3 Comparative Segment Analysis and Mix Shift
4. Market Segmentation by Application
4.1 Overview of the Application Segmentation Framework
4.1.1 Hospitals
4.1.1.1 Segment Definition and Strategic Context
4.1.1.2 Market Size, Share, and Forecast
4.1.1.3 Buyer Behaviour and Procurement Patterns
4.1.1.4 Connected Monitoring and Technology Content
4.1.1.5 Risks
4.1.2 Ambulatory Surgical Centers
4.1.2.1 Segment Definition and Strategic Context
4.1.2.2 Market Size, Share, and Forecast
4.1.2.3 Buyer Behaviour and Procurement Patterns
4.1.2.4 Risks
4.1.3 Other End Users (Long-Term Care, Home and Ambulatory, EMS)
4.1.3.1 Segment Definition and Strategic Context
4.1.3.2 Market Size, Share, and Forecast
4.1.3.3 Buyer Behaviour and Procurement Patterns
4.1.3.4 Risks
4.1.4 Comparative Analysis of Application Segments
5. Regional Market Forecast
5.1 North America
5.1.1 Regional Overview
5.1.2 Key Growth Drivers
5.1.3 Regulatory & Infrastructure Landscape
5.1.4 Country-Level Analysis
5.1.5 Market Forecast 2025–2031
5.2 Europe
5.2.1 Regional Overview
5.2.2 Key Growth Drivers
5.2.3 Regulatory & Infrastructure Landscape
5.2.4 Country-Level Analysis
5.2.5 Market Forecast 2025–2031
5.3 Asia Pacific
5.3.1 Regional Overview
5.3.2 Key Growth Drivers
5.3.3 Regulatory & Infrastructure Landscape
5.3.4 Country-Level Analysis
5.3.5 Market Forecast 2025–2031
5.4 Latin America
5.4.1 Regional Overview
5.4.2 Key Growth Drivers
5.4.3 Regulatory & Infrastructure Landscape
5.4.4 Country-Level Analysis
5.4.5 Market Forecast 2025–2031
5.5 Middle East and Africa
5.5.1 Regional Overview
5.5.2 Key Growth Drivers
5.5.3 Regulatory & Infrastructure Landscape
5.5.4 Country-Level Analysis
5.5.5 Market Forecast 2025–2031
6. Country-Level Market Forecast
6.1 North America
6.1.1 United States
6.1.2 Canada
6.1.3 Mexico
6.1.4 Rest of North America
6.2 Europe
6.2.1 Germany
6.2.2 United Kingdom
6.2.3 France
6.2.4 Italy
6.2.5 Spain
6.2.6 Netherlands
6.2.7 Rest of Europe
6.3 Asia Pacific
6.3.1 China
6.3.2 Japan
6.3.3 India
6.3.4 South Korea
6.3.5 Australia
6.3.6 Rest of Asia Pacific
6.4 Latin America
6.4.1 Brazil
6.4.2 Argentina
6.4.3 Chile
6.4.4 Colombia
6.4.5 Rest of Latin America
6.5 Middle East and Africa
6.5.1 Saudi Arabia
6.5.2 United Arab Emirates
6.5.3 South Africa
6.5.4 Turkey
6.5.5 Israel
6.5.6 Rest of Middle East and Africa
7. Growth Drivers & Inhibitors
7.1 Overview
7.2 Market Growth Drivers
7.2.1 Ageing Global Population and Rising Chronic Disease Burden
7.2.2 Expansion of Ambulatory and Non-Acute Care Settings
7.2.3 Integration of Connectivity, AI-Assisted Analytics, and Remote Monitoring Capabilities
7.2.4 Healthcare Infrastructure Investment in Emerging Markets
7.2.5 Post-Pandemic Capacity Expansion and Replacement Cycle Maturation
7.2.6 Low-Acuity Monitor Segment Growth and Democratisation of Monitoring Technology
7.3 Market Restraints
7.3.1 Hospital Capital Budget Constraints and Volume-Based Procurement Pressures
7.3.2 Intensifying Price Competition From Asian Manufacturers
7.3.3 Trade Policy Uncertainty and Tariff Risk on Medical Devices
7.3.4 Cybersecurity, Interoperability, and Extended Regulatory Clearance Timelines
7.3.5 Reimbursement Limitations in Emerging-Market Healthcare Systems
7.4 Impact Assessment Summary
7.5 Integrated Assessment
8. Key Company Profiles
8.1 Koninklijke Philips N.V.
8.1.1 Company Overview
8.1.2 Key Products & Segments
8.1.3 Financial Performance (2023–2025)
8.1.4 Business Strategy
8.1.5 SWOT Analysis
8.1.6 Strategic Implications (2025–2031)
8.2 GE HealthCare Technologies Inc.
8.2.1 Company Overview
8.2.2 Key Products & Segments
8.2.3 Financial Performance (2023–2025)
8.2.4 Business Strategy
8.2.5 SWOT Analysis
8.2.6 Strategic Implications (2025–2031)
8.3 Shenzhen Mindray Bio-Medical Electronics
8.3.1 Company Overview
8.3.2 Key Products & Segments
8.3.3 Financial Performance (2023–2025)
8.3.4 Business Strategy
8.3.5 SWOT Analysis
8.3.6 Strategic Implications (2025–2031)
8.4 Nihon Kohden Corporation
8.4.1 Company Overview
8.4.2 Key Products & Segments
8.4.3 Financial Performance (2023–2025)
8.4.4 Business Strategy
8.4.5 SWOT Analysis
8.4.6 Strategic Implications (2025–2031)
8.5 Drägerwerk AG & Co. KGaA
8.5.1 Company Overview
8.5.2 Key Products & Segments
8.5.3 Financial Performance (2023–2025)
8.5.4 Business Strategy
8.5.5 SWOT Analysis
8.5.6 Strategic Implications (2025–2031)
8.6 Medtronic plc
8.6.1 Company Overview
8.6.2 Key Products & Segments
8.6.3 Financial Performance (2023–2025)
8.6.4 Business Strategy
8.6.5 SWOT Analysis
8.6.6 Strategic Implications (2025–2031)
8.7 Masimo Corporation
8.7.1 Company Overview
8.7.2 Key Products & Segments
8.7.3 Financial Performance (2023–2025)
8.7.4 Business Strategy
8.7.5 SWOT Analysis
8.7.6 Strategic Implications (2025–2031)
8.8 OSI Systems, Inc.
8.8.1 Company Overview
8.8.2 Key Products & Segments
8.8.3 Financial Performance (2023–2025)
8.8.4 Business Strategy
8.8.5 SWOT Analysis
8.8.6 Strategic Implications (2025–2031)
8.9 Baxter International Inc.
8.9.1 Company Overview
8.9.2 Key Products & Segments
8.9.3 Financial Performance (2023–2025)
8.9.4 Business Strategy
8.9.5 SWOT Analysis
8.9.6 Strategic Implications (2025–2031)
8.10 Fukuda Denshi Co., Ltd.
8.10.1 Company Overview
8.10.2 Key Products & Segments
8.10.3 Financial Performance (2023–2025)
8.10.4 Business Strategy
8.10.5 SWOT Analysis
8.10.6 Strategic Implications (2025–2031)
8.11 Edan Instruments, Inc.
8.11.1 Company Overview
8.11.2 Key Products & Segments
8.11.3 Financial Performance (2023–2025)
8.11.4 Business Strategy
8.11.5 SWOT Analysis
8.11.6 Strategic Implications (2025–2031)
9. Competitive Landscape
9.1 Competitive Landscape Overview
9.1.1 Market Structure and Fragmentation
9.1.2 Market Size Context
9.1.3 Performance Divergence in 2025: A Structural Signal
9.1.4 Profiled Companies: Verified Facts (No Share Estimates)
9.1.5 Overall Competitive Intensity Rating
9.2 Competitive Intensity Assessment
9.2.1 Qualitative Grouping Framework
9.2.2 Global Integrated Health-Technology Groups
9.2.3 Monitoring Specialists and Regional Vendors
9.2.4 Value-Oriented and Niche Vendors
9.2.5 Capacity vs. Demand Dynamics
9.2.6 Pricing Environment
9.2.7 Barriers to Entry and Exit
9.3 Key Player Strategies & Positioning
9.3.1 Strategic Group Mapping
9.3.2 Differentiation Strategies by Major Player
9.3.3 M&A and Partnership Activity, 2022–Present
9.3.4 R&D and Technology Investment Trends
9.4 Competitive Dynamics & Strategic Outlook
9.4.1 The Competitive Landscape in Transition
9.4.2 Emerging Competitive Threats
9.4.3 Consolidation vs. Fragmentation Outlook
9.4.4 Competitive Response Matrix
9.4.5 Geographic Competitive Dynamics
9.4.6 Strategic Recommendations for 2025–2031
10. Porter's Five Forces Analysis
10.1 Threat of New Entrants
10.2 Bargaining Power of Buyers
10.3 Bargaining Power of Suppliers
10.4 Threat of Substitutes
10.5 Competitive Rivalry
11. PESTLE Analysis
11.1 Overview
11.2 Political
11.2.1 Government Healthcare Investment Mandates
11.2.2 Geopolitical Tensions and China Market Dynamics
11.2.3 Public Procurement Frameworks and Tendering Cycles
11.2.4 International Health Governance and WHO Frameworks
11.3 Economic
11.3.1 Healthcare Capital Expenditure Cycles
11.3.2 Currency Volatility and International Revenue Exposure
11.3.3 Healthcare System Funding Models and Reimbursement
11.3.4 Pricing Pressure and Value-Tier Competition
11.4 Social
11.4.1 Ageing Global Population and Chronic Disease Burden
11.4.2 Growth in Critical Care Infrastructure and ICU Capacity
11.4.3 Workforce Constraints and the Case for Remote Monitoring
11.4.4 Patient Empowerment and Home-Based Monitoring Trends
11.5 Technological
11.5.1 Connectivity, Cloud Integration, and Enterprise Monitoring Platforms
11.5.2 Artificial Intelligence and Clinical Decision Support
11.5.3 Miniaturisation and Wearable Sensor Innovation
11.5.4 Cybersecurity Requirements and System Complexity
11.6 Legal and Regulatory
11.6.1 Medical Device Regulatory Approval Pathways
11.6.2 Post-Market Surveillance and Recall Risk
11.6.3 Data Privacy and Health Information Regulations
11.6.4 Reimbursement Classification and Coverage Policies
11.7 Environmental
11.7.1 Sustainability Mandates and Green Procurement Standards
11.7.2 E-Waste Regulation and End-of-Life Obligations
11.7.3 Climate Risk and Supply Chain Resilience
11.8 PESTLE Summary Table
11.9 Synthesis and Strategic Implications
12. SWOT Analysis
12.1 Industry SWOT Analysis
12.1.1 SWOT Summary Matrix
12.1.2 Detailed Analysis
12.1.2.1 Strengths
12.1.2.2 Weaknesses
12.1.2.3 Opportunities
12.1.2.4 Threats
12.1.3 Strategic Implications
13. Future Trends & Outlook
13.1 Key Future Trends
13.1.1 AI-Augmented Clinical Decision Support Embedded in Monitoring Platforms
13.1.2 Decentralisation of Monitoring Across Ambulatory, Home, and Step-Down Settings
13.1.3 Enterprise Connectivity and Interoperability as a Hospital Procurement Criterion
13.1.4 Geographic Demand Polarisation
13.1.5 Wearable Sensor Technology and Continuous Non-Invasive Parameter Expansion
13.1.6 Regulatory Modernisation and Cybersecurity Compliance Raising Market Entry Barriers
13.1.7 Pricing Pressure and Cost-Engineering in Mid- and Low-Acuity Segments
13.1.8 Strategic Consolidation, Portfolio Rationalisation, and M&A Activity
13.2 Trend Summary Matrix
13.3 Forward Outlook: 2026–2031
List of Exhibits
Exhibit 2.1: Forecast of Global Market YoY Growth Rate & CAGR Summary (in %)
Exhibit 2.2: Forecast of Global Market YoY Growth Rate & CAGR Summary (in %)
Exhibit 2.3: Forecast of Global (in USD Bn)
Exhibit 2.4: Forecast of North America (in USD Bn)
Exhibit 2.5: Forecast of Europe (in USD Bn)
Exhibit 2.6: Forecast of Asia Pacific (in USD Bn)
Exhibit 2.7: Forecast of Latin America (in USD Bn)
Exhibit 2.8: Forecast of Middle East and Africa (in USD Bn)
Exhibit 2.9: Forecast of Global (in Mn Units)
Exhibit 2.10: Forecast of North America (in Mn Units)
Exhibit 2.11: Forecast of Europe (in Mn Units)
Exhibit 2.12: Forecast of Asia Pacific (in Mn Units)
Exhibit 2.13: Forecast of Latin America (in Mn Units)
Exhibit 2.14: Forecast of Middle East and Africa (in Mn Units)
Exhibit 3.15: Forecast of High-Acuity Monitors (in USD Bn)
Exhibit 3.16: Forecast of High-Acuity Monitors (in Mn Units)
Exhibit 3.17: Forecast of Mid-Acuity Monitors (in USD Bn)
Exhibit 3.18: Forecast of Mid-Acuity Monitors (in Mn Units)
Exhibit 3.19: Forecast of Low-Acuity Monitors (in USD Bn)
Exhibit 3.20: Forecast of Low-Acuity Monitors (in Mn Units)
Exhibit 4.21: Forecast of Hospitals (in USD Bn)
Exhibit 4.22: Forecast of Hospitals (in Mn Units)
Exhibit 4.23: Forecast of Ambulatory Surgical Centers (in USD Bn)
Exhibit 4.24: Forecast of Ambulatory Surgical Centers (in Mn Units)
Exhibit 4.25: Forecast of Segment Application (in USD Bn)
Exhibit 4.26: Forecast of Segment Application (in Mn Units)
Exhibit 6.27: Forecast of North America (in USD Bn)
Exhibit 6.28: Forecast of United States (in USD Bn)
Exhibit 6.29: Forecast of Canada (in USD Bn)
Exhibit 6.30: Forecast of Mexico (in USD Bn)
Exhibit 6.31: Forecast of Rest of North America (in USD Bn)
Exhibit 6.32: Forecast of North America (in Mn Units)
Exhibit 6.33: Forecast of United States (in Mn Units)
Exhibit 6.34: Forecast of Canada (in Mn Units)
Exhibit 6.35: Forecast of Mexico (in Mn Units)
Exhibit 6.36: Forecast of Europe (in USD Bn)
Exhibit 6.37: Forecast of Germany (in USD Bn)
Exhibit 6.38: Forecast of United Kingdom (in USD Bn)
Exhibit 6.39: Forecast of France (in USD Bn)
Exhibit 6.40: Forecast of Italy (in USD Bn)
Exhibit 6.41: Forecast of Spain (in USD Bn)
Exhibit 6.42: Forecast of Netherlands (in USD Bn)
Exhibit 6.43: Forecast of Rest of Europe (in USD Bn)
Exhibit 6.44: Forecast of Europe (in Mn Units)
Exhibit 6.45: Forecast of Germany (in Mn Units)
Exhibit 6.46: Forecast of United Kingdom (in Mn Units)
Exhibit 6.47: Forecast of France (in Mn Units)
Exhibit 6.48: Forecast of Italy (in Mn Units)
Exhibit 6.49: Forecast of Spain (in Mn Units)
Exhibit 6.50: Forecast of Rest of Europe (in Mn Units)
Exhibit 6.51: Forecast of Asia Pacific (in USD Bn)
Exhibit 6.52: Forecast of China (in USD Bn)
Exhibit 6.53: Forecast of Japan (in USD Bn)
Exhibit 6.54: Forecast of India (in USD Bn)
Exhibit 6.55: Forecast of South Korea (in USD Bn)
Exhibit 6.56: Forecast of Australia (in USD Bn)
Exhibit 6.57: Forecast of Rest of Asia Pacific (in USD Bn)
Exhibit 6.58: Forecast of Asia Pacific (in Mn Units)
Exhibit 6.59: Forecast of China (in Mn Units)
Exhibit 6.60: Forecast of Japan (in Mn Units)
Exhibit 6.61: Forecast of India (in Mn Units)
Exhibit 6.62: Forecast of South Korea (in Mn Units)
Exhibit 6.63: Forecast of Australia (in Mn Units)
Exhibit 6.64: Forecast of Rest of Asia Pacific (in Mn Units)
Exhibit 6.65: Forecast of Latin America (in USD Bn)
Exhibit 6.66: Forecast of Brazil (in USD Bn)
Exhibit 6.67: Forecast of Argentina (in USD Bn)
Exhibit 6.68: Forecast of Chile (in USD Bn)
Exhibit 6.69: Forecast of Colombia (in USD Bn)
Exhibit 6.70: Forecast of Rest of Latin America (in USD Bn)
Exhibit 6.71: Forecast of Latin America (in Mn Units)
Exhibit 6.72: Forecast of Brazil (in Mn Units)
Exhibit 6.73: Forecast of Rest of Latin America (in Mn Units)
Exhibit 6.74: Forecast of Middle East and Africa (in USD Bn)
Exhibit 6.75: Forecast of Saudi Arabia (in USD Bn)
Exhibit 6.76: Forecast of United Arab Emirates (in USD Bn)
Exhibit 6.77: Forecast of South Africa (in USD Bn)
Exhibit 6.78: Forecast of Turkey (in USD Bn)
Exhibit 6.79: Forecast of Israel (in USD Bn)
Exhibit 6.80: Forecast of Rest of Middle East and Africa (in USD Bn)
Exhibit 6.81: Forecast of Middle East and Africa (in Mn Units)
Exhibit 6.82: Forecast of Saudi Arabia (in Mn Units)
Exhibit 6.83: Forecast of Rest of Middle East and Africa (in Mn Units)
*If Applicable.

NAVADHI is a market research company that helps global firms differentiate themselves, break market entry barriers, track their investments, develop business strategies and plan for future by providing actionable market research intelligence that helps them succeed.