
NAVADHI Market Research
Published on NAVADHI Market Research (https://www.navadhi.com)

Home > Global Memory Market Strategic Research Report 2026-2031

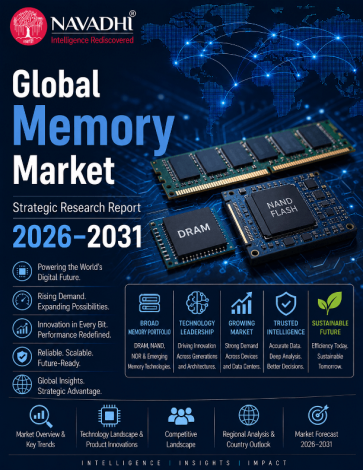
Global Memory Market Strategic Research Report 2026-2031

Global Memory Market Strategic Research Report 2026-2031
Publication ID: 
NAV0826026
Publication Date: 
August 01, 2026
Pages: 
246
Countries: 
Global [1]
Please choose the suitable license type from above. More details are at given under tab "Report License Types" below.

The global semiconductor memory market - encompassing DRAM, NAND Flash, and High Bandwidth Memory (HBM) chip segments - is estimated at US$ 214.80 billion in 2025, anchored directly to World Semiconductor Trade Statistics (WSTS), the authoritative non-profit semiconductor industry trade association. The market is forecast to reach US$ 658.87 billion by 2031, a CAGR of approximately 20.5% (2026-2031). This forecast is grounded in primary-source anchoring rather than third-party aggregator modeling, given a documented up-to-2x divergence across third-party sources for the identical 2025 base year.

Market structure is a confirmed five-company oligopoly: Samsung Electronics, SK hynix (including HBM leadership at 56.4-58% share depending on source), Micron Technology, Kioxia Corporation, and SanDisk Corporation. SK hynix has committed US$720 billion to triple its memory production capacity by 2034, described by CNBC as the world's largest memory fab buildout, reflecting the real, current 2025-2026 memory 'supercycle' driven by AI/HBM demand.

This report covers market sizing and volume analysis (2022-2031), segmentation by memory type and application, full country-level forecasts across all five regions, verified company profiles, competitive landscape, Porter's Five Forces, PESTLE, and SWOT analysis.

  1. 1. Executive Summary
    1. 1.1 Global Memory Market Strategic Research Report
    2. 1.2 Market Scale and Forecast Trajectory
    3. 1.3 The 2025-2026 Memory Supercycle: Confirmed and Quantified
    4. 1.4 High Bandwidth Memory: The Defining Sub-Segment
    5. 1.5 Competitive Structure: A Highly Concentrated Global Market
    6. 1.6 Regional Geography: Production-Weighted Framework
    7. 1.7 Key Risks and the Balanced Forward Assessment
    8. 1.8 Summary of Key Metrics
  2. 2. Industry Overview & Forecast
    1. 2.1 Market Size and Historical Performance
    2. 2.2 Methodology and Source Framework
    3. 2.3 The 2025-2026 Memory Supercycle: The Defining Near-Term Dynamic
    4. 2.4 Volume Analysis
    5. 2.5 Forecast Growth Trajectory: 2026-2031
  3. 3. Market Segmentation by Type
    1. 3.1 Structural Overview
    2. 3.2 DRAM (Excluding HBM)
    3. 3.2.1 Market Size and Trajectory
    4. 3.2.2 Demand Drivers and Competitive Context
    5. 3.3 High Bandwidth Memory (HBM)
    6. 3.3.1 Market Size and Trajectory
    7. 3.3.2 Technology and Demand Context
    8. 3.3.3 Share Trajectory
    9. 3.4 NAND Flash and Other
    10. 3.4.1 Market Size and Trajectory
    11. 3.4.2 Composition and Emerging Memory Technologies
    12. 3.5 Volume Analysis
    13. 3.5.1 Year-by-Year Volume Table
    14. 3.5.2 Volume Trend and Demand Drivers
    15. 3.5.3 Price/Mix Effect and the Value-Volume CAGR Divergence
    16. 3.6 Segmentation Summary and Compositional Outlook
  4. 4. Market Segmentation by Application
    1. 4.1 Overview
    2. 4.2 Data Center & Cloud
    3. 4.3 Mobile/Consumer Electronics
    4. 4.4 PC/Computing
    5. 4.5 Automotive & Industrial
    6. 4.6 Other Applications
    7. 4.7 Application Segmentation: Synthesis and Strategic Implications
  5. 5. Regional Market Forecast
    1. 5.1 Asia Pacific
    2. 5.1.1 Regional Overview
    3. 5.1.2 Key Growth Drivers
    4. 5.1.3 Regulatory & Infrastructure Landscape
    5. 5.1.4 Country-Level Analysis
    6. 5.1.5 Market Forecast 2025-2031
    7. 5.2 North America
    8. 5.2.1 Regional Overview
    9. 5.2.2 Key Growth Drivers
    10. 5.2.3 Regulatory & Infrastructure Landscape
    11. 5.2.4 Country-Level Analysis
    12. 5.2.5 Market Forecast 2025-2031
    13. 5.3 Europe
    14. 5.3.1 Regional Overview
    15. 5.3.2 Key Growth Drivers
    16. 5.3.3 Regulatory & Infrastructure Landscape
    17. 5.3.4 Country-Level Analysis
    18. 5.3.5 Market Forecast 2025-2031
    19. 5.4 Latin America
    20. 5.4.1 Regional Overview
    21. 5.4.2 Key Growth Drivers
    22. 5.4.3 Regulatory & Infrastructure Landscape
    23. 5.4.4 Country-Level Analysis
    24. 5.4.5 Market Forecast 2025-2031
    25. 5.5 Middle East & Africa
    26. 5.5.1 Regional Overview
    27. 5.5.2 Key Growth Drivers
    28. 5.5.3 Regulatory & Infrastructure Landscape
    29. 5.5.4 Country-Level Analysis
    30. 5.5.5 Market Forecast 2025-2031
  6. 6. Country-Level Market Forecast
    1. 6.1 Asia Pacific
    2. 6.1.1 South Korea
    3. 6.1.2 Taiwan
    4. 6.1.3 Japan
    5. 6.1.4 China
    6. 6.1.5 Singapore
    7. 6.1.6 Rest of Asia Pacific
    8. 6.2 North America
    9. 6.2.1 United States
    10. 6.2.2 Canada
    11. 6.2.3 Mexico
    12. 6.3 Europe
    13. 6.3.1 Germany
    14. 6.3.2 Netherlands
    15. 6.3.3 Ireland
    16. 6.3.4 United Kingdom
    17. 6.3.5 Rest of Europe
    18. 6.4 Latin America
    19. 6.4.1 Brazil
    20. 6.4.2 Mexico
    21. 6.4.3 Rest of Latin America
    22. 6.5 Middle East & Africa
    23. 6.5.1 United Arab Emirates
    24. 6.5.2 Saudi Arabia
    25. 6.5.3 Israel
    26. 6.5.4 Rest of MEA
  7. 7. Growth Drivers & Inhibitors
    1. 7.1 Structural Overview
    2. 7.2 Primary Growth Drivers
    3. 7.2.1 Artificial Intelligence Infrastructure Buildout and HBM Demand Acceleration
    4. 7.2.2 Confirmed Capital Investment in Advanced Packaging and HBM Capacity
    5. 7.2.3 Technology Roadmap Execution
    6. 7.2.4 Secular Enterprise and Cloud Infrastructure Expansion
    7. 7.2.5 Automotive and Industrial Memory Content Growth
    8. 7.3 Market Inhibitors and Structural Risk Factors
    9. 7.3.1 Extraordinary Near-Term Average Selling Price Volatility
    10. 7.3.2 Historical Memory Market Cyclicality as a Structural Risk
    11. 7.3.3 Oligopolistic Supply Concentration Risk
    12. 7.3.4 Geopolitical and Export Control Exposure
    13. 7.4 Integrated Driver-Inhibitor Assessment
  8. 8. Key Company Profiles
    1. 8.1 Samsung Electronics Co., Ltd.
    2. 8.1.1 Company Overview
    3. 8.1.2 Key Products & Segments
    4. 8.1.3 Financial Performance (2023-2025)
    5. 8.1.4 Business Strategy
    6. 8.1.5 SWOT Analysis
    7. 8.1.6 Strategic Implications (2025-2031)
    8. 8.2 SK hynix Inc.
    9. 8.2.1 Company Overview
    10. 8.2.2 Key Products & Segments
    11. 8.2.3 Financial Performance (2023-2025)
    12. 8.2.4 Business Strategy
    13. 8.2.5 SWOT Analysis
    14. 8.2.6 Strategic Implications (2025-2031)
    15. 8.3 Micron Technology, Inc.
    16. 8.3.1 Company Overview
    17. 8.3.2 Key Products & Segments
    18. 8.3.3 Financial Performance (2023-2025)
    19. 8.3.4 Business Strategy
    20. 8.3.5 SWOT Analysis
    21. 8.3.6 Strategic Implications (2025-2031)
    22. 8.4 Kioxia Corporation
    23. 8.4.1 Company Overview
    24. 8.4.2 Key Products & Segments
    25. 8.4.3 Financial Performance (2023-2025)
    26. 8.4.4 Business Strategy
    27. 8.4.5 SWOT Analysis
    28. 8.4.6 Strategic Implications (2025-2031)
    29. 8.5 SanDisk Corporation
    30. 8.5.1 Company Overview
    31. 8.5.2 Key Products & Segments
    32. 8.5.3 Financial Performance (2023-2025)
    33. 8.5.4 Business Strategy
    34. 8.5.5 SWOT Analysis
    35. 8.5.6 Strategic Implications (2025-2031)
  9. 9. Competitive Landscape
    1. 9.1 Competitive Landscape Overview
    2. 9.2 Competitive Intensity Assessment
    3. 9.2.1 Player Tier Breakdown
    4. 9.2.2 Capacity vs. Demand Dynamics
    5. 9.2.3 Pricing Environment
    6. 9.2.4 Barriers to Entry and Exit
    7. 9.3 Key Player Strategies & Positioning
    8. 9.3.1 Strategic Group Map: Three Tiers Within the Oligopoly
    9. 9.3.2 SK Hynix: HBM Dominance and Unprecedented Capital Commitment
    10. 9.3.3 Samsung: Recovering Challenger in HBM, Defending Broad Leadership
    11. 9.3.4 Micron
    12. 9.3.5 Kioxia and SanDisk: NAND-Focused Specialists
    13. 9.3.6 Key Player Positioning Summary
    14. 9.3.7 M&A, Partnerships, and R&D Investment Trends (2022-Present)
    15. 9.4 Competitive Dynamics & Strategic Outlook
    16. 9.4.1 Emerging Competitive Threats and Adjacent Market Entrants
    17. 9.4.2 Consolidation vs. Fragmentation Outlook
    18. 9.4.3 Competitive Response Matrix
    19. 9.4.4 Strategic Recommendations for 2025-2031
  10. 10. Porter's Five Forces Analysis
    1. 10.1 Threat of New Entrants
    2. 10.2 Bargaining Power of Buyers
    3. 10.3 Bargaining Power of Suppliers
    4. 10.4 Threat of Substitutes
    5. 10.5 Competitive Rivalry
  11. 11. PESTLE Analysis
    1. 11.1 Political
    2. 11.2 Economic
    3. 11.3 Social
    4. 11.4 Technological
    5. 11.5 Legal
    6. 11.6 Environmental
  12. 12. SWOT Analysis
    1. 12.1 Strengths
    2. 12.1.1 Oligopolistic Market Structure and Pricing Power
    3. 12.1.2 HBM Technology Differentiation and Premium Positioning
    4. 12.1.3 AI-Era Demand as a Structural Growth Catalyst
    5. 12.1.4 Sovereign Industrial Policy Support
    6. 12.2 Weaknesses
    7. 12.2.1 Extreme Capital Intensity and Long Investment Cycles
    8. 12.2.2 Inherent Historical Cyclicality
    9. 12.2.3 Concentrated Geographic Manufacturing Base and Single-Company HBM Dependency
    10. 12.2.4 Technology Execution Risk in Generational Transitions
    11. 12.3 Opportunities
    12. 12.3.1 Multi-Year AI Infrastructure Demand Expansion
    13. 12.3.2 HBM4 Mainstream Adoption and Bandwidth Economy Expansion
    14. 12.3.3 Market Share Redistribution as SK hynix Leadership Is Contested
    15. 12.3.4 Emerging Application Vectors Beyond Hyperscale AI
    16. 12.4 Threats
    17. 12.4.1 Supply-Demand Rebalancing and ASP Correction Risk
    18. 12.4.2 Geopolitical and Export Control Escalation
    19. 12.4.3 Technology Leadership Disruption and Competitive Convergence
    20. 12.4.4 Environmental Regulatory and Resource Constraint Exposure
  13. 13. Future Trends & Outlook
    1. 13.1 Structural Growth Trajectory: 2026-2031 Forecast Horizon
    2. 13.2 AI Infrastructure Demand as a Multi-Year Structural Catalyst
    3. 13.3 HBM Technology Generation Roadmap and Competitive Redistribution
    4. 13.4 Capacity Investment Cycle and Supply-Demand Equilibrium Outlook
    5. 13.5 Geopolitical and Regulatory Dynamics: Evolving Risk Landscape
    6. 13.6 Environmental and Sustainability Considerations
    7. 13.7 Strategic Outlook Summary
List of Exhibits
Exhibit 2.1: Forecast of Global Market YoY Growth Rate & CAGR Summary (in %)
Exhibit 2.2: Forecast of Global Market YoY Growth Rate & CAGR Summary (in %)
Exhibit 2.3: Forecast of Global (in USD Bn)
Exhibit 2.4: Forecast of Asia Pacific (in USD Bn)
Exhibit 2.5: Forecast of North America (in USD Bn)
Exhibit 2.6: Forecast of Europe (in USD Bn)
Exhibit 2.7: Forecast of Latin America (in USD Bn)
Exhibit 2.8: Forecast of Middle East & Africa (in USD Bn)
Exhibit 2.9: Forecast of Global (in eb)
Exhibit 2.10: Forecast of Asia Pacific (in eb)
Exhibit 2.11: Forecast of North America (in eb)
Exhibit 2.12: Forecast of Europe (in eb)
Exhibit 2.13: Forecast of Latin America (in eb)
Exhibit 2.14: Forecast of Middle East & Africa (in eb)
Exhibit 3.15: Forecast of DRAM (excl. HBM) (in USD Bn)
Exhibit 3.16: Forecast of DRAM (excl. HBM) (in eb)
Exhibit 3.17: Forecast of HBM (High Bandwidth Memory) (in USD Bn)
Exhibit 3.18: Forecast of HBM (High Bandwidth Memory) (in eb)
Exhibit 3.19: Forecast of NAND Flash and Other (in USD Bn)
Exhibit 3.20: Forecast of NAND Flash and Other (in eb)
Exhibit 4.21: Forecast of Data Center & Cloud (in USD Bn)
Exhibit 4.22: Forecast of Data Center & Cloud (in eb)
Exhibit 4.23: Forecast of Mobile/Consumer Electronics (in USD Bn)
Exhibit 4.24: Forecast of Mobile/Consumer Electronics (in eb)
Exhibit 4.25: Forecast of PC/Computing (in USD Bn)
Exhibit 4.26: Forecast of PC/Computing (in eb)
Exhibit 4.27: Forecast of Automotive & Industrial (in USD Bn)
Exhibit 4.28: Forecast of Automotive & Industrial (in eb)
Exhibit 4.29: Forecast of Other (in USD Bn)
Exhibit 4.30: Forecast of Other (in eb)
Exhibit 6.31: Forecast of Asia Pacific (in USD Bn)
Exhibit 6.32: Forecast of South Korea (in USD Bn)
Exhibit 6.33: Forecast of Taiwan (in USD Bn)
Exhibit 6.34: Forecast of Japan (in USD Bn)
Exhibit 6.35: Forecast of China (in USD Bn)
Exhibit 6.36: Forecast of Singapore (in USD Bn)
Exhibit 6.37: Forecast of Rest of Asia Pacific (in USD Bn)
Exhibit 6.38: Forecast of Asia Pacific (in eb)
Exhibit 6.39: Forecast of South Korea (in eb)
Exhibit 6.40: Forecast of Taiwan (in eb)
Exhibit 6.41: Forecast of Japan (in eb)
Exhibit 6.42: Forecast of China (in eb)
Exhibit 6.43: Forecast of Singapore (in eb)
Exhibit 6.44: Forecast of Rest of Asia Pacific (in eb)
Exhibit 6.45: Forecast of North America (in USD Bn)
Exhibit 6.46: Forecast of United States (in USD Bn)
Exhibit 6.47: Forecast of Canada (in USD Bn)
Exhibit 6.48: Forecast of Mexico (in USD Bn)
Exhibit 6.49: Forecast of North America (in eb)
Exhibit 6.50: Forecast of United States (in eb)
Exhibit 6.51: Forecast of Canada (in eb)
Exhibit 6.52: Forecast of Mexico (in eb)
Exhibit 6.53: Forecast of Europe (in USD Bn)
Exhibit 6.54: Forecast of Germany (in USD Bn)
Exhibit 6.55: Forecast of Netherlands (in USD Bn)
Exhibit 6.56: Forecast of Ireland (in USD Bn)
Exhibit 6.57: Forecast of United Kingdom (in USD Bn)
Exhibit 6.58: Forecast of Rest of Europe (in USD Bn)
Exhibit 6.59: Forecast of Europe (in eb)
Exhibit 6.60: Forecast of Germany (in eb)
Exhibit 6.61: Forecast of Netherlands (in eb)
Exhibit 6.62: Forecast of Ireland (in eb)
Exhibit 6.63: Forecast of United Kingdom (in eb)
Exhibit 6.64: Forecast of Rest of Europe (in eb)
Exhibit 6.65: Forecast of Latin America (in USD Bn)
Exhibit 6.66: Forecast of Brazil (in USD Bn)
Exhibit 6.67: Forecast of Mexico (in USD Bn)
Exhibit 6.68: Forecast of Rest of Latin America (in USD Bn)
Exhibit 6.69: Forecast of Latin America (in eb)
Exhibit 6.70: Forecast of Brazil (in eb)
Exhibit 6.71: Forecast of Mexico (in eb)
Exhibit 6.72: Forecast of Rest of Latin America (in eb)
Exhibit 6.73: Forecast of Middle East & Africa (in USD Bn)
Exhibit 6.74: Forecast of United Arab Emirates (in USD Bn)
Exhibit 6.75: Forecast of Saudi Arabia (in USD Bn)
Exhibit 6.76: Forecast of Israel (in USD Bn)
Exhibit 6.78: Forecast of Middle East & Africa (in eb)
Exhibit 6.79: Forecast of United Arab Emirates (in eb)
Exhibit 6.80: Forecast of Saudi Arabia (in eb)
Exhibit 6.81: Forecast of Israel (in eb)
Exhibit 6.82: Forecast of Rest of MEA (in eb)
  1. Samsung Electronics
  2. SK hynix
  3. Micron Technology
  4. Kioxia Corporation
  5. SanDisk Corporation

Single User License (PDF)

  • This license allows for use of a publication by one person.
  • This person may print out a single copy of the publication.
  • This person can include information given in the publication in presentations and internal reports by providing full copyright credit to the publisher.
  • This person cannot share the publication (or any information contained therein) with any other person or persons.
  • Unless a Enterprise License is purchased, a Single User License must be purchased for every person that wishes to use the publication within the same organization.
  • Customers who infringe these license terms are liable for a Enterprise license fee.


Site License (PDF)*

  • This license allows for use of a publication by all users within one corporate location, e.g. a regional office.
  • These users may print out a single copy of the publication.
  • These users can include information given in the publication in presentations and internal reports by providing full copyright credit to the publisher.
  • These users cannot share the publication (or any information contained therein) with any other person or persons outside the corporate location for which the publication is purchased.
  • Unless a Enterprise License is purchased, a Site User License must be purchased for every corporate location by an organization that wishes to use the publication within the same organization.
  • Customers who infringe these license terms are liable for a Enterprise license fee.


Enterprise License (PDF)*

  • This license allows for use of a publication by unlimited users within the purchasing organization e.g. all employees of a single company.
  • Each of these people may use the publication on any computer, and may print out the report, but may not share the publication (or any information contained therein) with any other person or persons outside of the organization.
  • These employees of purchasing organization can include information given in the publication in presentations and internal reports by providing full copyright credit to the publisher.

*If Applicable.

About Us

NAVADHI is a market research company that helps global firms differentiate themselves, break market entry barriers, track their investments, develop business strategies and plan for future by providing actionable market research intelligence that helps them succeed.

Infomation

  • About Us
  • Publications
  • FAQs
  • Privacy Policy
  • Terms & Conditions
  • Careers
  • Press Releases
  • Contact

Source URL:https://www.navadhi.com/publications/global-memory-market-strategic-research-report-2026-2031

Links
[1] https://www.navadhi.com/countries/global
