


The global logistics and supply chain industry is estimated at US$5,365,565.0 million in 2025 and is forecast to reach US$6,871,023.0 million by 2031, a compound annual growth rate (CAGR) of 4.2% over 2025-2031. Physical volume, measured on a handling basis across all modal layers, is estimated at 104,681.8 million tonnes in 2025, rising to 118,844.8 million tonnes in 2031. Asia Pacific is the largest region at US$2,382,256.7 million (44.4% share) in 2025, and North America is the fastest-growing region at a 4.4% CAGR.
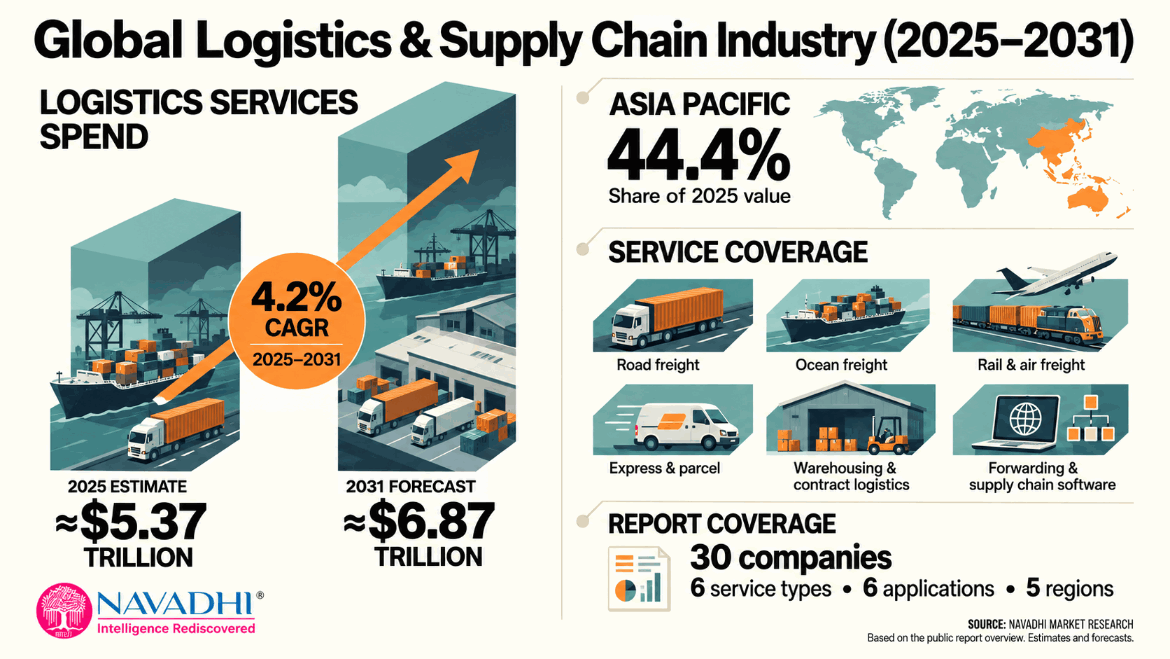
The report sizes spend on logistics services: road freight, rail and air freight, ocean freight, express and parcel delivery, warehousing and contract logistics, and forwarding and supply chain software. Freight forwarding and brokerage are counted at net revenue only, to avoid double counting carrier cost. Inventory carrying cost, shipper administration, port and terminal operations and pipelines are excluded. The estimate is built bottom-up from sourced US and China figures (CSCMP, IATA, Container Trades Statistics and national statistics offices) scaled to the world with stated multiples, and cross-checked against global logistics cost benchmarks; the report gives a Monte Carlo 5th-95th percentile band of US$5,074,136 million to US$5,831,359 million and states which channels rest on published figures and which on analyst estimates.
Scope of the Global Logistics & Supply Chain Industry Strategic Research Report
This report covers market value (US$ million) and volume (million tonnes) for 2022-2031, with 2025 as the base year and 2026-2031 as the forecast period. It analyses six service types, six end-use application verticals, five regions and country-level markets (23 named countries and regional groupings plus five rest-of-region groups), and profiles 30 companies across integrators, forwarders, contract logistics providers, container carriers and regional leaders. Where a figure could not be verified from a public source, the report says so and does not present it as fact.
Segment by Type
Segment by Application
Segment by Region
Companies Profiled
Deutsche Post DHL Group (DHL), United Parcel Service, Inc. (UPS), FedEx Corporation, A.P. Moller - Maersk A/S, DSV A/S, Kuehne + Nagel International AG, C.H. Robinson Worldwide, Inc., XPO, Inc., J.B. Hunt Transport Services, Inc., Ryder System, Inc., GXO Logistics, Inc., Expeditors International of Washington, Inc., Nippon Express Holdings, Inc., SF Holding Co., Ltd., JD Logistics, Inc., ZTO Express (Cayman) Inc., Sinotrans Limited, COSCO SHIPPING Holdings Co., Ltd., Orient Overseas Container Line (OOCL), Mediterranean Shipping Company (MSC), CMA CGM Group, Hapag-Lloyd AG, Ocean Network Express (ONE), Evergreen Marine Corporation, HMM Co., Ltd., Yang Ming Marine Transport Corporation, ZIM Integrated Shipping Services Ltd., DP World, Amazon Logistics (Amazon.com, Inc.), Delhivery Limited.
Who Can Use This Report?
| 1. Executive Summary 1.1 Market Definition and Scope 1.2 Market Size and Growth Trajectory 1.3 Principal Growth Drivers 1.4 Segmentation Highlights 1.4.1 By Service Type 1.4.2 By Application 1.4.3 By Region 1.5 Competitive Landscape and Key Strategic Developments 1.6 Principal Risks and Restraints 1.7 Strategic Outlook 2. Industry Overview & Forecast 2.1 Market Definition and Scope 2.2 Market Size and Historical Performance 2.3 Forecast and Growth Logic 2.4 Volume Analysis 2.5 Value-Chain Positioning and Pricing Dynamics 3. Market Segmentation by Type 3.1 Overview of the Type Segmentation Framework 3.2 Volume Analysis 3.2.1 Global Freight Volume Trend, 2022–2031 3.3 Road Freight Transportation 3.3.1 Segment Definition and Role 3.3.2 Market Value and Share 3.3.3 Forecast and Growth Drivers 3.3.4 Technology, Pricing, and Competitive Dynamics 3.3.5 Risks 3.4 Ocean Freight Transportation 3.4.1 Segment Definition and Role 3.4.2 Market Value and Share 3.4.3 Forecast and Growth Drivers 3.4.4 Technology, Pricing, and Competitive Dynamics 3.4.5 Risks 3.5 Rail & Air Freight 3.5.1 Segment Definition and Role 3.5.2 Market Value and Share 3.5.3 Forecast and Growth Drivers 3.5.4 Technology, Pricing, and Competitive Dynamics 3.5.5 Risks 3.6 Express & Parcel Services 3.6.1 Segment Definition and Role 3.6.2 Market Value and Share 3.6.3 Forecast and Growth Drivers 3.6.4 Technology, Pricing, and Competitive Dynamics 3.6.5 Risks 3.7 Warehousing & Contract Logistics 3.7.1 Segment Definition and Role 3.7.2 Market Value and Share 3.7.3 Forecast and Growth Drivers 3.7.4 Technology, Pricing, and Competitive Dynamics 3.7.5 Risks 3.8 Forwarding & Supply Chain Software 3.8.1 Segment Definition and Role 3.8.2 Market Value and Share 3.8.3 Forecast and Growth Drivers 3.8.4 Technology, Pricing, and Competitive Dynamics 3.8.5 Risks 3.9 Comparative Analysis and Segment Mix Shift 4. Market Segmentation by Application 4.1 Overview and Structural Logic 4.1.1 Retail and E-Commerce 4.1.2 Manufacturing and Industrial 4.1.3 Food, Beverage and Healthcare 4.1.4 Energy, Chemicals and Mining 4.1.5 Automotive and Aerospace 4.1.6 Other Applications 4.2 Comparative Assessment of Application Segments 5. Regional Market Forecast 5.1 North America 5.1.1 Regional Overview 5.1.2 Key Growth Drivers 5.1.3 Regulatory & Infrastructure Landscape 5.1.4 Country-Level Analysis 5.1.5 Market Forecast 2025–2031 5.2 Europe 5.2.1 Regional Overview 5.2.2 Key Growth Drivers 5.2.3 Regulatory & Infrastructure Landscape 5.2.4 Country-Level Analysis 5.2.5 Market Forecast 2025–2031 5.3 Asia Pacific 5.3.1 Regional Overview 5.3.2 Key Growth Drivers 5.3.3 Regulatory & Infrastructure Landscape 5.3.4 Country-Level Analysis 5.3.5 Market Forecast 2025–2031 5.4 Latin America 5.4.1 Regional Overview 5.4.2 Key Growth Drivers 5.4.3 Regulatory & Infrastructure Landscape 5.4.4 Country-Level Analysis 5.4.5 Market Forecast 2025–2031 5.5 Middle East and Africa 5.5.1 Regional Overview 5.5.2 Key Growth Drivers 5.5.3 Regulatory & Infrastructure Landscape 5.5.4 Country-Level Analysis 5.5.5 Market Forecast 2025–2031 6. Country-Level Market Forecast 6.1 North America 6.1.1 United States 6.1.2 Canada 6.1.3 Mexico 6.1.4 Rest of North America 6.2 Europe 6.2.1 Germany 6.2.2 United Kingdom 6.2.3 France 6.2.4 Italy 6.2.5 Netherlands 6.2.6 Rest of Europe 6.3 Asia Pacific 6.3.1 China 6.3.2 Japan 6.3.3 India 6.3.4 South Korea 6.3.5 Australia 6.3.6 Southeast Asia 6.3.7 Rest of Asia Pacific 6.4 Latin America 6.4.1 Brazil 6.4.2 Argentina 6.4.3 Chile 6.4.4 Colombia 6.4.5 Rest of Latin America 6.5 Middle East and Africa 6.5.1 United Arab Emirates 6.5.2 Saudi Arabia 6.5.3 South Africa 6.5.4 Turkey 6.5.5 Egypt 6.5.6 Rest of Middle East and Africa 7. Growth Drivers & Inhibitors 7.1 Growth Drivers 7.1.1 E-Commerce Penetration and the Structural Shift in Last-Mile Demand 7.1.2 Supply Chain Restructuring and Near-Shoring Investment 7.1.3 Industrial-Scale M&A and Network Consolidation 7.1.4 Digitalisation, Automation, and Supply Chain Technology Adoption 7.1.5 Asia Pacific Infrastructure Investment and Emerging Market Demand Growth 7.1.6 Healthcare, Cold Chain, and Specialised Logistics Demand 7.2 Restraints 7.2.1 Freight Rate Compression and Structural Capacity Oversupply in Ocean Shipping 7.2.2 Weak Seaborne Trade Growth and Tariff-Driven Trade Flow Distortion 7.2.3 Geopolitical Disruption, Route Diversion, and Fuel Cost Volatility 7.2.4 Efficiency Gains Compressing Revenue Growth Relative to GDP Expansion 7.2.5 Regulatory Complexity and Compliance Cost Burden 7.3 Impact Assessment Summary 7.4 Integrated Assessment 8. Key Company Profiles 8.1 Deutsche Post DHL Group (DHL) 8.1.1 Company Overview 8.1.2 Key Products & Segments 8.1.3 Financial Performance (2023–2025) 8.1.4 Business Strategy 8.1.5 SWOT Analysis 8.1.6 Strategic Implications (2025–2031) 8.2 United Parcel Service, Inc. (UPS) 8.2.1 Company Overview 8.2.2 Key Products & Segments 8.2.3 Financial Performance (2023–2025) 8.2.4 Business Strategy 8.2.5 SWOT Analysis 8.2.6 Strategic Implications (2025–2031) 8.3 FedEx Corporation 8.3.1 Company Overview 8.3.2 Key Products & Segments 8.3.3 Financial Performance (2023–2025) 8.3.4 Business Strategy 8.3.5 SWOT Analysis 8.3.6 Strategic Implications (2025–2031) 8.4 A.P. Moller - Maersk A/S 8.4.1 Company Overview 8.4.2 Key Products & Segments 8.4.3 Financial Performance (2023–2025) 8.4.4 Business Strategy 8.4.5 SWOT Analysis 8.4.6 Strategic Implications (2025–2031) 8.5 DSV A/S 8.5.1 Company Overview 8.5.2 Key Products & Segments 8.5.3 Financial Performance (2023–2025) 8.5.4 Business Strategy 8.5.5 SWOT Analysis 8.5.6 Strategic Implications (2025–2031) 8.6 Kuehne + Nagel International AG 8.6.1 Company Overview 8.6.2 Key Products & Segments 8.6.3 Financial Performance (2023–2025) 8.6.4 Business Strategy 8.6.5 SWOT Analysis 8.6.6 Strategic Implications (2025–2031) 8.7 C.H. Robinson Worldwide, Inc. 8.7.1 Company Overview 8.7.2 Key Products & Segments 8.7.3 Financial Performance (2023–2025) 8.7.4 Business Strategy 8.7.5 SWOT Analysis 8.7.6 Strategic Implications (2025–2031) 8.8 XPO, Inc. 8.8.1 Company Overview 8.8.2 Key Products & Segments 8.8.3 Financial Performance (2023–2025) 8.8.4 Business Strategy 8.8.5 SWOT Analysis 8.8.6 Strategic Implications (2025–2031) 8.9 J.B. Hunt Transport Services, Inc. 8.9.1 Company Overview 8.9.2 Key Products & Segments 8.9.3 Financial Performance (2023–2025) 8.9.4 Business Strategy 8.9.5 SWOT Analysis 8.9.6 Strategic Implications (2025–2031) 8.10 Ryder System, Inc. 8.10.1 Company Overview 8.10.2 Key Products & Segments 8.10.3 Financial Performance (2023–2025) 8.10.4 Business Strategy 8.10.5 SWOT Analysis 8.10.6 Strategic Implications (2025–2031) 8.11 GXO Logistics, Inc. 8.11.1 Company Overview 8.11.2 Key Products & Segments 8.11.3 Financial Performance (2023–2025) 8.11.4 Business Strategy 8.11.5 SWOT Analysis 8.11.6 Strategic Implications (2025–2031) 8.12 Expeditors International of Washington, Inc. 8.12.1 Company Overview 8.12.2 Key Products & Segments 8.12.3 Financial Performance (2023–2025) 8.12.4 Business Strategy 8.12.5 SWOT Analysis 8.12.6 Strategic Implications (2025–2031) 8.13 Nippon Express Holdings, Inc. 8.13.1 Company Overview 8.13.2 Key Products & Segments 8.13.3 Financial Performance (2023–2025) 8.13.4 Business Strategy 8.13.5 SWOT Analysis 8.13.6 Strategic Implications (2025–2031) 8.14 SF Holding Co., Ltd. 8.14.1 Company Overview 8.14.2 Key Products & Segments 8.14.3 Financial Performance (2023–2025) 8.14.4 Business Strategy 8.14.5 SWOT Analysis 8.14.6 Strategic Implications (2025–2031) 8.15 JD Logistics, Inc. 8.15.1 Company Overview 8.15.2 Key Products & Segments 8.15.3 Financial Performance (2023–2025) 8.15.4 Business Strategy 8.15.5 SWOT Analysis 8.15.6 Strategic Implications (2025–2031) 8.16 ZTO Express (Cayman) Inc. 8.16.1 Company Overview 8.16.2 Key Products & Segments 8.16.3 Financial Performance (2023–2025) 8.16.4 Business Strategy 8.16.5 SWOT Analysis 8.16.6 Strategic Implications (2025–2031) 8.17 Sinotrans Limited 8.17.1 Company Overview 8.17.2 Key Products & Segments 8.17.3 Financial Performance (2023–2025) 8.17.4 Business Strategy 8.17.5 SWOT Analysis 8.17.6 Strategic Implications (2025–2031) 8.18 COSCO SHIPPING Holdings Co., Ltd. 8.18.1 Company Overview 8.18.2 Key Products & Segments 8.18.3 Financial Performance (2023–2025) 8.18.4 Business Strategy 8.18.5 SWOT Analysis 8.18.6 Strategic Implications (2025–2031) 8.19 Orient Overseas Container Line (OOCL) 8.19.1 Company Overview 8.19.2 Key Products & Segments 8.19.3 Financial Performance (2023–2025) 8.19.4 Business Strategy 8.19.5 SWOT Analysis 8.19.6 Strategic Implications (2025–2031) 8.20 Mediterranean Shipping Company (MSC) 8.20.1 Company Overview 8.20.2 Key Products & Segments 8.20.3 Financial Performance (2023–2025) 8.20.4 Business Strategy 8.20.5 SWOT Analysis 8.20.6 Strategic Implications (2025–2031) 8.21 CMA CGM Group 8.21.1 Company Overview 8.21.2 Key Products & Segments 8.21.3 Financial Performance (2023–2025) 8.21.4 Business Strategy 8.21.5 SWOT Analysis 8.21.6 Strategic Implications (2025–2031) 8.22 Hapag-Lloyd AG 8.22.1 Company Overview 8.22.2 Key Products & Segments 8.22.3 Financial Performance (2023–2025) 8.22.4 Business Strategy 8.22.5 SWOT Analysis 8.22.6 Strategic Implications (2025–2031) 8.23 Ocean Network Express (ONE) 8.23.1 Company Overview 8.23.2 Key Products & Segments 8.23.3 Financial Performance (2023–2025) 8.23.4 Business Strategy 8.23.5 SWOT Analysis 8.23.6 Strategic Implications (2025–2031) 8.24 Evergreen Marine Corporation 8.24.1 Company Overview 8.24.2 Key Products & Segments 8.24.3 Financial Performance (2023–2025) 8.24.4 Business Strategy 8.24.5 SWOT Analysis 8.24.6 Strategic Implications (2025–2031) 8.25 HMM Co., Ltd. 8.25.1 Company Overview 8.25.2 Key Products & Segments 8.25.3 Financial Performance (2023–2025) 8.25.4 Business Strategy 8.25.5 SWOT Analysis 8.25.6 Strategic Implications (2025–2031) 8.26 Yang Ming Marine Transport Corporation 8.26.1 Company Overview 8.26.2 Key Products & Segments 8.26.3 Financial Performance (2023–2025) 8.26.4 Business Strategy 8.26.5 SWOT Analysis 8.26.6 Strategic Implications (2025–2031) 8.27 ZIM Integrated Shipping Services Ltd. 8.27.1 Company Overview 8.27.2 Key Products & Segments 8.27.3 Financial Performance (2023–2025) 8.27.4 Business Strategy 8.27.5 SWOT Analysis 8.27.6 Strategic Implications (2025–2031) 8.28 DP World 8.28.1 Company Overview 8.28.2 Key Products & Segments 8.28.3 Financial Performance (2023–2025) 8.28.4 Business Strategy 8.28.5 SWOT Analysis 8.28.6 Strategic Implications (2025–2031) 8.29 Amazon Logistics (Amazon.com, Inc.) 8.29.1 Company Overview 8.29.2 Key Products & Segments 8.29.3 Financial Performance (2023–2025) 8.29.4 Business Strategy 8.29.5 SWOT Analysis 8.29.6 Strategic Implications (2025–2031) 8.30 Delhivery Limited 8.30.1 Company Overview 8.30.2 Key Products & Segments 8.30.3 Financial Performance (2023–2025) 8.30.4 Business Strategy 8.30.5 SWOT Analysis 8.30.6 Strategic Implications (2025–2031) 9. Competitive Landscape 9.1 Competitive Landscape Overview 9.1.1 Market Structure and the Challenge of Measuring Concentration 9.1.2 Company Reference Table 9.1.3 Strategic Observations on Market Structure 9.1.4 Overall Competitive Intensity Assessment 9.2 Competitive Intensity Assessment 9.2.1 Company Groupings by Strategic Profile 9.2.2 Capacity Versus Demand Dynamics 9.2.3 Pricing Environment 9.2.4 Barriers to Entry and Exit 9.3 Key Player Strategies & Positioning 9.3.1 Strategic Group Map: Four Competitive Clusters 9.3.2 Differentiation Strategies 9.3.3 Geographic Strongholds 9.3.4 M&A and Partnership Activity, 2022–Present 9.3.5 R&D and Technology Investment Trends 9.4 Competitive Dynamics & Strategic Outlook 9.4.1 Emerging Competitive Threats 9.4.2 Consolidation vs. Fragmentation Outlook 9.4.3 Strategic Response Matrix 9.4.4 Strategic Recommendations for 2025–2031 10. Porter's Five Forces Analysis 10.1 Threat of New Entrants 10.2 Bargaining Power of Buyers 10.3 Bargaining Power of Suppliers 10.4 Threat of Substitutes 10.5 Competitive Rivalry 11. PESTLE Analysis 11.1 Political 11.2 Economic 11.3 Social 11.4 Technological 11.5 Environmental 11.6 Legal 11.7 PESTLE Impact Summary 12. SWOT Analysis 12.1 Industry SWOT Analysis 12.1.1 Detailed Analysis 12.1.1.1 Strengths 12.1.1.2 Weaknesses 12.1.1.3 Opportunities 12.1.1.4 Threats 12.1.2 Strategic Implications and Priority Actions 13. Future Trends & Outlook 13.1 Trend Analysis 13.1.1 Accelerated Platformisation and Digital Freight Brokerage 13.1.2 Consolidation-Driven Scale Economies in Global Forwarding 13.1.3 Structural Overcapacity and Rate Normalisation in Container Shipping 13.1.4 Decarbonisation as a Competitive Differentiator 13.1.5 E-Commerce and Last-Mile Logistics as a Structural Growth Engine 13.1.6 Artificial Intelligence and Automation Redefining Warehouse and Network Operations 13.1.7 Geopolitical Fragmentation and Supply Chain Regionalisation 13.1.8 Healthcare and High-Value Vertical Specialisation 13.2 Summary Trend Matrix 13.3 Forward Outlook: 2026–2031 List of Exhibits Exhibit 2.1: Forecast of Global Market YoY Growth Rate & CAGR Summary (in %) Exhibit 2.2: Forecast of Global Market YoY Growth Rate & CAGR Summary (in %) Exhibit 2.3: Forecast of Global (in USD Bn) Exhibit 2.4: Forecast of North America (in USD Bn) Exhibit 2.5: Forecast of Europe (in USD Bn) Exhibit 2.6: Forecast of Asia Pacific (in USD Bn) Exhibit 2.7: Forecast of Latin America (in USD Bn) Exhibit 2.8: Forecast of Middle East and Africa (in USD Bn) Exhibit 2.9: Forecast of Global (in Mt) Exhibit 2.10: Forecast of North America (in Mt) Exhibit 2.11: Forecast of Europe (in Mt) Exhibit 2.12: Forecast of Asia Pacific (in Mt) Exhibit 2.13: Forecast of Latin America (in Mt) Exhibit 2.14: Forecast of Middle East and Africa (in Mt) Exhibit 3.15: Forecast of Road Freight Transportation (in USD Bn) Exhibit 3.16: Forecast of Road Freight Transportation (in Mt) Exhibit 3.17: Forecast of Ocean Freight Transportation (in USD Bn) Exhibit 3.18: Forecast of Ocean Freight Transportation (in Mt) Exhibit 3.19: Forecast of Rail & Air Freight (in USD Bn) Exhibit 3.20: Forecast of Rail & Air Freight (in Mt) Exhibit 3.21: Forecast of Express & Parcel Services (in USD Bn) Exhibit 3.22: Forecast of Express & Parcel Services (in Mt) Exhibit 3.23: Forecast of Warehousing & Contract Logistics (in USD Bn) Exhibit 3.24: Forecast of Warehousing & Contract Logistics (in Mt) Exhibit 3.25: Forecast of Forwarding & Supply Chain Software (in USD Bn) Exhibit 3.26: Forecast of Forwarding & Supply Chain Software (in Mt) Exhibit 4.27: Forecast of Retail & E-Commerce (in USD Bn) Exhibit 4.28: Forecast of Retail & E-Commerce (in Mt) Exhibit 4.29: Forecast of Manufacturing & Industrial (in USD Bn) Exhibit 4.30: Forecast of Manufacturing & Industrial (in Mt) Exhibit 4.31: Forecast of Food & Beverage and Healthcare (in USD Bn) Exhibit 4.32: Forecast of Food & Beverage and Healthcare (in Mt) Exhibit 4.33: Forecast of Energy Chemicals & Mining (in USD Bn) Exhibit 4.34: Forecast of Energy Chemicals & Mining (in Mt) Exhibit 4.35: Forecast of Automotive & Aerospace (in USD Bn) Exhibit 4.36: Forecast of Automotive & Aerospace (in Mt) Exhibit 4.37: Forecast of Other Applications (in USD Bn) Exhibit 4.38: Forecast of Other Applications (in Mt) Exhibit 6.39: Forecast of North America (in USD Bn) Exhibit 6.40: Forecast of United States (in USD Bn) Exhibit 6.41: Forecast of Canada (in USD Bn) Exhibit 6.42: Forecast of Mexico (in USD Bn) Exhibit 6.43: Forecast of Rest of North America (in USD Bn) Exhibit 6.44: Forecast of North America (in Mt) Exhibit 6.45: Forecast of United States (in Mt) Exhibit 6.46: Forecast of Canada (in Mt) Exhibit 6.47: Forecast of Mexico (in Mt) Exhibit 6.48: Forecast of Rest of North America (in Mt) Exhibit 6.49: Forecast of Europe (in USD Bn) Exhibit 6.50: Forecast of Germany (in USD Bn) Exhibit 6.51: Forecast of United Kingdom (in USD Bn) Exhibit 6.52: Forecast of France (in USD Bn) Exhibit 6.53: Forecast of Italy (in USD Bn) Exhibit 6.54: Forecast of Netherlands (in USD Bn) Exhibit 6.55: Forecast of Rest of Europe (in USD Bn) Exhibit 6.56: Forecast of Europe (in Mt) Exhibit 6.57: Forecast of Germany (in Mt) Exhibit 6.58: Forecast of United Kingdom (in Mt) Exhibit 6.59: Forecast of France (in Mt) Exhibit 6.60: Forecast of Italy (in Mt) Exhibit 6.61: Forecast of Netherlands (in Mt) Exhibit 6.62: Forecast of Rest of Europe (in Mt) Exhibit 6.63: Forecast of Asia Pacific (in USD Bn) Exhibit 6.64: Forecast of China (in USD Bn) Exhibit 6.65: Forecast of Japan (in USD Bn) Exhibit 6.66: Forecast of India (in USD Bn) Exhibit 6.67: Forecast of South Korea (in USD Bn) Exhibit 6.68: Forecast of Australia (in USD Bn) Exhibit 6.69: Forecast of Southeast Asia (in USD Bn) Exhibit 6.70: Forecast of Rest of Asia Pacific (in USD Bn) Exhibit 6.71: Forecast of Asia Pacific (in Mt) Exhibit 6.72: Forecast of China (in Mt) Exhibit 6.73: Forecast of Japan (in Mt) Exhibit 6.74: Forecast of India (in Mt) Exhibit 6.75: Forecast of South Korea (in Mt) Exhibit 6.76: Forecast of Australia (in Mt) Exhibit 6.77: Forecast of Southeast Asia (in Mt) Exhibit 6.78: Forecast of Rest of Asia Pacific (in Mt) Exhibit 6.79: Forecast of Latin America (in USD Bn) Exhibit 6.80: Forecast of Brazil (in USD Bn) Exhibit 6.81: Forecast of Argentina (in USD Bn) Exhibit 6.82: Forecast of Chile (in USD Bn) Exhibit 6.83: Forecast of Colombia (in USD Bn) Exhibit 6.84: Forecast of Rest of Latin America (in USD Bn) Exhibit 6.85: Forecast of Latin America (in Mt) Exhibit 6.86: Forecast of Brazil (in Mt) Exhibit 6.87: Forecast of Argentina (in Mt) Exhibit 6.88: Forecast of Chile (in Mt) Exhibit 6.89: Forecast of Colombia (in Mt) Exhibit 6.90: Forecast of Rest of Latin America (in Mt) Exhibit 6.91: Forecast of Middle East and Africa (in USD Bn) Exhibit 6.92: Forecast of United Arab Emirates (in USD Bn) Exhibit 6.93: Forecast of Saudi Arabia (in USD Bn) Exhibit 6.94: Forecast of South Africa (in USD Bn) Exhibit 6.95: Forecast of Turkey (in USD Bn) Exhibit 6.96: Forecast of Egypt (in USD Bn) Exhibit 6.97: Forecast of Rest of Middle East and Africa (in USD Bn) Exhibit 6.98: Forecast of Middle East and Africa (in Mt) Exhibit 6.99: Forecast of United Arab Emirates (in Mt) Exhibit 6.100: Forecast of Saudi Arabia (in Mt) Exhibit 6.101: Forecast of South Africa (in Mt) Exhibit 6.102: Forecast of Turkey (in Mt) Exhibit 6.103: Forecast of Egypt (in Mt) Exhibit 6.104: Forecast of Rest of Middle East and Africa (in Mt) |
*If Applicable.

NAVADHI is a market research company that helps global firms differentiate themselves, break market entry barriers, track their investments, develop business strategies and plan for future by providing actionable market research intelligence that helps them succeed.