
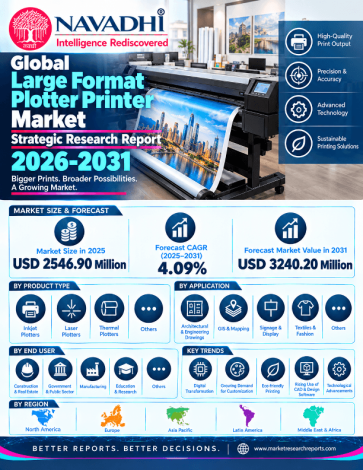

The global large format plotter printer market is valued at US$2,546.9 million in 2025 and is forecast to reach US$3,240.2 million by 2031, a compound annual growth rate (CAGR) of 4.1% over 2025-2031. Unit shipments are estimated at about 289,400 in 2025, rising to about 323,600 by 2031 (1.9% a year), so most of the value growth comes from price and product-mix. Published third-party estimates cover wider scopes and are not directly comparable; the report states its scope and triangulates the US$2,546.9 million base from a bottom-up channel model and published market sizes. Average selling prices and the base size are model estimates.
Large format plotter printers are roll-fed and hybrid wide-format inkjet printers, typically 24 inches (610 mm) and wider, used for CAD and technical drawings, posters, photo and proofing, signage and advertising graphics, textile and apparel decoration, and decor and industrial applications. The scope covers aqueous, eco-solvent, solvent and latex, UV-curable and dye-sublimation and textile inkjet hardware. Ink, media, software and services sold separately are excluded.
Scope of the Global Large Format Plotter Printer Market Strategic Research Report
This report covers market value (US$ million) and unit volume (million units) for 2022-2031, with 2025 as the base year and 2026-2031 as the forecast period. It analyses ink-technology segments and application segments, five regions and 20 countries, 11 profiled companies, competitive structure, Porter's Five Forces, PESTLE, SWOT and future trends. No company discloses large format plotter revenue, so the report presents verified company facts and does not state company market shares or concentration ratios.
Segment by Type
Segment by Application
Who Can Use This Report?
| 1. Executive Summary 1.1 Market Definition and Size 1.2 Primary Growth Drivers 1.3 Segment Highlights 1.4 Regional and Country Highlights 1.5 Competitive Structure and Key Corporate Developments 1.6 Principal Market Risks 1.7 Closing Outlook 2. Industry Overview & Forecast 2.1 Market Definition and Scope 2.2 Market Size and Historical Performance 2.3 Forecast and Growth Logic 2.4 Volume Analysis 2.5 Value-Chain Positioning and Pricing Dynamics 3. Market Segmentation by Type 3.1 Overview 3.2 Volume Analysis 3.2.1 Aqueous (Dye and Pigment) Inkjet 3.2.2 Eco-Solvent, Solvent and Latex Inkjet 3.2.3 UV-Curable Inkjet 3.2.4 Dye-Sublimation and Textile Inkjet 3.3 Comparative Mix-Shift Analysis 4. Market Segmentation by Application 4.1 Overview of the Application Landscape 4.1.1 CAD, Technical and GIS Printing 4.1.2 Posters, Photo and Proofing 4.1.3 Signage and Advertising Graphics 4.1.4 Textile and Apparel 4.1.5 Other (Decor, Packaging Proofing and Industrial) 4.2 Comparative Assessment of Application Segments 5. Regional Market Forecast 5.1 North America 5.1.1 Regional Overview 5.1.2 Key Growth Drivers 5.1.3 Regulatory & Infrastructure Landscape 5.1.4 Country-Level Analysis 5.1.5 Market Forecast 2025–2031 5.2 Europe 5.2.1 Regional Overview 5.2.2 Key Growth Drivers 5.2.3 Regulatory & Infrastructure Landscape 5.2.4 Country-Level Analysis 5.2.5 Market Forecast 2025–2031 5.3 Asia Pacific 5.3.1 Regional Overview 5.3.2 Key Growth Drivers 5.3.3 Regulatory & Infrastructure Landscape 5.3.4 Country-Level Analysis 5.3.5 Market Forecast 2025–2031 5.4 Latin America 5.4.1 Regional Overview 5.4.2 Key Growth Drivers 5.4.3 Regulatory & Infrastructure Landscape 5.4.4 Country-Level Analysis 5.4.5 Market Forecast 2025–2031 5.5 Middle East and Africa 5.5.1 Regional Overview 5.5.2 Key Growth Drivers 5.5.3 Regulatory & Infrastructure Landscape 5.5.4 Country-Level Analysis 5.5.5 Market Forecast 2025–2031 6. Country-Level Market Forecast 6.1 North America 6.1.1 United States 6.1.2 Canada 6.1.3 Mexico 6.1.4 Rest of North America 6.2 Europe 6.2.1 Germany 6.2.2 United Kingdom 6.2.3 France 6.2.4 Italy 6.2.5 Spain 6.2.6 Rest of Europe 6.3 Asia Pacific 6.3.1 China 6.3.2 Japan 6.3.3 India 6.3.4 South Korea 6.3.5 Australia 6.3.6 Rest of Asia Pacific 6.4 Latin America 6.4.1 Brazil 6.4.2 Argentina 6.4.3 Colombia 6.4.4 Rest of Latin America 6.5 Middle East and Africa 6.5.1 Saudi Arabia 6.5.2 United Arab Emirates 6.5.3 South Africa 6.5.4 Turkey 6.5.5 Rest of Middle East and Africa 7. Growth Drivers & Inhibitors 7.1 Executive Context 7.2 Growth Drivers 7.2.1 Structural Expansion of the Textile and Apparel Digital Printing Addressable Market 7.2.2 Signage and Advertising Graphics 7.2.3 Printhead Innovation and Productivity Enhancement Driving Price-Mix Improvement 7.2.4 Ink Consumable Revenue and Aftermarket Monetisation Models 7.2.5 Asia Pacific Urbanisation, Manufacturing Investment, and Digital Print Infrastructure 7.2.6 Decorative, Packaging Proofing, and Industrial Print Vertical Diversification 7.3 Restraints 7.3.1 Structural Volume Decline in CAD, Technical, and GIS Printing 7.3.2 Tariff Exposure, Currency Volatility, and Input Cost Inflation 7.3.3 Weakness in Industrial and Automotive End-Market Demand 7.3.4 Consolidation Among Specialist Vendors and Loss of Independent Innovation Centres 7.3.5 Regulatory Compliance Costs and Environmental Ink Chemistry Constraints 7.4 Impact Assessment Summary 7.5 Integrated Assessment 8. Key Company Profiles 8.1 HP Inc. 8.1.1 Company Overview 8.1.2 Key Products & Segments 8.1.3 Financial Performance (2023–2025) 8.1.4 Business Strategy 8.1.5 SWOT Analysis 8.1.6 Strategic Implications (2025–2031) 8.2 Canon Inc. 8.2.1 Company Overview 8.2.2 Key Products & Segments 8.2.3 Financial Performance (2023–2025) 8.2.4 Business Strategy 8.2.5 SWOT Analysis 8.2.6 Strategic Implications (2025–2031) 8.3 Seiko Epson Corporation 8.3.1 Company Overview 8.3.2 Key Products & Segments 8.3.3 Financial Performance (2023–2025) 8.3.4 Business Strategy 8.3.5 SWOT Analysis 8.3.6 Strategic Implications (2025–2031) 8.4 Ricoh Company, Ltd. 8.4.1 Company Overview 8.4.2 Key Products & Segments 8.4.3 Financial Performance (2023–2025) 8.4.4 Business Strategy 8.4.5 SWOT Analysis 8.4.6 Strategic Implications (2025–2031) 8.5 Xerox Holdings Corporation 8.5.1 Company Overview 8.5.2 Key Products & Segments 8.5.3 Financial Performance (2023–2025) 8.5.4 Business Strategy 8.5.5 SWOT Analysis 8.5.6 Strategic Implications (2025–2031) 8.6 Roland DG Corporation 8.6.1 Company Overview 8.6.2 Key Products & Segments 8.6.3 Financial Performance (2023–2025) 8.6.4 Business Strategy 8.6.5 SWOT Analysis 8.6.6 Strategic Implications (2025–2031) 8.7 Mimaki Engineering Co., Ltd. 8.7.1 Company Overview 8.7.2 Key Products & Segments 8.7.3 Financial Performance (2023–2025) 8.7.4 Business Strategy 8.7.5 SWOT Analysis 8.7.6 Strategic Implications (2025–2031) 8.8 Mutoh Holdings Co., Ltd. 8.8.1 Company Overview 8.8.2 Key Products & Segments 8.8.3 Financial Performance (2023–2025) 8.8.4 Business Strategy 8.8.5 SWOT Analysis 8.8.6 Strategic Implications (2025–2031) 8.9 Durst Group AG 8.9.1 Company Overview 8.9.2 Key Products & Segments 8.9.3 Financial Performance (2023–2025) 8.9.4 Business Strategy 8.9.5 SWOT Analysis 8.9.6 Strategic Implications (2025–2031) 8.10 Agfa-Gevaert NV 8.10.1 Company Overview 8.10.2 Key Products & Segments 8.10.3 Financial Performance (2023–2025) 8.10.4 Business Strategy 8.10.5 SWOT Analysis 8.10.6 Strategic Implications (2025–2031) 8.11 Brother Industries, Ltd. 8.11.1 Company Overview 8.11.2 Key Products & Segments 8.11.3 Financial Performance (2023–2025) 8.11.4 Business Strategy 8.11.5 SWOT Analysis 8.11.6 Strategic Implications (2025–2031) 9. Competitive Landscape 9.1 Competitive Landscape Overview 9.1.1 Market Structure and Data Constraints 9.1.2 Dated Public Reference Points (IDC 2019, InfoTrends 2015) 9.1.3 Profiled Companies: Verified Facts (No Share Estimates) 9.1.4 Structural Developments Reshaping the Landscape 9.1.5 Overall Competitive Intensity Assessment 9.2 Competitive Intensity Assessment 9.2.1 Qualitative Grouping Framework 9.2.2 Diversified Printing Groups 9.2.3 Wide-Format Specialists: Mimaki, Roland DG, Mutoh, Durst and Agfa 9.2.4 Chinese and Emerging-Market Makers 9.2.5 Capacity vs. Demand Dynamics 9.2.6 Pricing Environment 9.2.7 Barriers to Entry and Exit 9.3 Key Player Strategies & Positioning 9.3.1 Strategic Group Mapping 9.3.2 Differentiation Strategies by Major Player 9.3.3 M&A and Partnership Activity, 2022–Present 9.3.4 R&D and Technology Investment Trends 9.4 Competitive Dynamics & Strategic Outlook 9.4.1 The Competitive Landscape in Transition 9.4.2 Emerging Competitive Threats 9.4.3 Consolidation vs. Fragmentation Outlook 9.4.4 Competitive Response Matrix 9.4.5 Geographic Competitive Dynamics 9.4.6 Strategic Recommendations for 2025–2031 10. Porter's Five Forces Analysis 10.1 Threat of New Entrants 10.2 Bargaining Power of Buyers 10.3 Bargaining Power of Suppliers 10.4 Threat of Substitutes 10.5 Competitive Rivalry 11. PESTLE Analysis 11.1 Overview and Analytical Framework 11.2 Political 11.2.1 Trade Tariffs and Hardware Import Duties 11.2.2 Government Infrastructure and Smart-City Procurement 11.2.3 Geopolitical Fragmentation and Supply-Chain Reshoring 11.2.4 Defence and Security Sector Demand 11.3 Economic 11.3.1 Currency Volatility and Yen-Denominated Cost Structures 11.3.2 Capital Expenditure Cycles and End-User Investment Sentiment 11.3.3 Raw Material and Component Cost Inflation 11.3.4 Emerging Market GDP Growth and Demand Democratisation 11.4 Sociocultural 11.4.1 Growth of Visual Branding and Experiential Marketing 11.4.2 Textile Customisation and the On-Demand Economy 11.4.3 Digital Fabrication and Maker Culture in Design Professions 11.4.4 Ageing Reprographics Workforce and Digital Transition Pressure 11.5 Technological 11.5.1 Ink Technology Platform Evolution 11.5.2 Integration of Artificial Intelligence and Workflow Automation 11.5.3 Print Resolution, Speed, and Substrate Range Advances 11.5.4 Connectivity, Cloud, and the Internet of Print Things 11.6 Legal and Regulatory 11.6.1 Environmental Regulation of Inks and Volatile Organic Compounds 11.6.2 Intellectual Property and Patent Thicket Dynamics 11.6.3 Data Privacy and Networked Device Compliance 11.6.4 Public Procurement and Local Content Rules 11.7 Environmental 11.7.1 Sustainability Mandates and Green Procurement Standards 11.7.2 Circular Economy Pressures on Hardware and Consumables 11.7.3 Energy Consumption and Carbon Footprint of High-Volume Production Systems 11.7.4 Climate Risk and Disruption to Paper and Substrate Supply Chains 11.8 PESTLE Summary Assessment Table 12. SWOT Analysis 12.1 Industry SWOT Analysis 12.1.1 Detailed Analysis 12.1.1.1 Strengths 12.1.1.2 Weaknesses 12.1.1.3 Opportunities 12.1.1.4 Threats 12.1.2 Strategic Implications 13. Future Trends & Outlook 13.1 Identified Future Trends 13.1.1 Structural Shift from Solvent to Latex and Aqueous Ink Technologies 13.1.2 Accelerating Penetration of Textile and Direct-to-Film Printing 13.1.3 Consolidation and Strategic Realignment Among Mid-Tier Specialists 13.1.4 Divergence Between Volume Decline and Revenue Growth via Price-Mix Enrichment 13.1.5 Integration of Ink, Software, and Connectivity Within Managed Service Models 13.1.6 Growth of Asia Pacific as Both Consumer and Manufacturing Hub 13.1.7 Regulatory Pressure and Sustainability Requirements Reshaping Product Development 13.1.8 Adoption of UV-Curable Inkjet Expanding Substrate and Application Range 13.2 Summary of Trends 13.3 Forward Outlook: 2026–2031 List of Exhibits Exhibit 2.1: Forecast of Global Market YoY Growth Rate & CAGR Summary (in %) Exhibit 2.2: Forecast of Global Market YoY Growth Rate & CAGR Summary (in %) Exhibit 2.3: Forecast of Global (in USD Bn) Exhibit 2.4: Forecast of North America (in USD Bn) Exhibit 2.5: Forecast of Europe (in USD Bn) Exhibit 2.6: Forecast of Asia Pacific (in USD Bn) Exhibit 2.7: Forecast of Latin America (in USD Bn) Exhibit 2.8: Forecast of Middle East and Africa (in USD Bn) Exhibit 2.9: Forecast of Global (in Mn Units) Exhibit 2.10: Forecast of North America (in Mn Units) Exhibit 2.11: Forecast of Europe (in Mn Units) Exhibit 2.12: Forecast of Asia Pacific (in Mn Units) Exhibit 3.13: Forecast of Aqueous (Dye and Pigment) Inkjet (in USD Bn) Exhibit 3.14: Forecast of Aqueous (Dye and Pigment) Inkjet (in Mn Units) Exhibit 3.15: Forecast of Eco-Solvent, Solvent and Latex Inkjet (in USD Bn) Exhibit 3.16: Forecast of Eco-Solvent, Solvent and Latex Inkjet (in Mn Units) Exhibit 3.17: Forecast of UV-Curable Inkjet (in USD Bn) Exhibit 3.18: Forecast of Dye-Sublimation and Textile Inkjet (in USD Bn) Exhibit 4.19: Forecast of CAD, Technical and GIS Printing (in USD Bn) Exhibit 4.20: Forecast of CAD, Technical and GIS Printing (in Mn Units) Exhibit 4.21: Forecast of Posters, Photo and Proofing (in USD Bn) Exhibit 4.22: Forecast of Posters, Photo and Proofing (in Mn Units) Exhibit 4.23: Forecast of Signage and Advertising Graphics (in USD Bn) Exhibit 4.24: Forecast of Signage and Advertising Graphics (in Mn Units) Exhibit 4.25: Forecast of Textile and Apparel (in USD Bn) Exhibit 4.26: Forecast of Other (Decor, Packaging Proofing and Industrial) (in USD Bn) Exhibit 6.27: Forecast of North America (in USD Bn) Exhibit 6.28: Forecast of United States (in USD Bn) Exhibit 6.29: Forecast of Canada (in USD Bn) Exhibit 6.30: Forecast of Mexico (in USD Bn) Exhibit 6.31: Forecast of Rest of North America (in USD Bn) Exhibit 6.32: Forecast of North America (in Mn Units) Exhibit 6.33: Forecast of United States (in Mn Units) Exhibit 6.34: Forecast of Europe (in USD Bn) Exhibit 6.35: Forecast of Germany (in USD Bn) Exhibit 6.36: Forecast of United Kingdom (in USD Bn) Exhibit 6.37: Forecast of France (in USD Bn) Exhibit 6.38: Forecast of Italy (in USD Bn) Exhibit 6.39: Forecast of Spain (in USD Bn) Exhibit 6.40: Forecast of Rest of Europe (in USD Bn) Exhibit 6.41: Forecast of Europe (in Mn Units) Exhibit 6.42: Forecast of Asia Pacific (in USD Bn) Exhibit 6.43: Forecast of China (in USD Bn) Exhibit 6.44: Forecast of Japan (in USD Bn) Exhibit 6.45: Forecast of India (in USD Bn) Exhibit 6.46: Forecast of South Korea (in USD Bn) Exhibit 6.47: Forecast of Australia (in USD Bn) Exhibit 6.48: Forecast of Rest of Asia Pacific (in USD Bn) Exhibit 6.49: Forecast of Asia Pacific (in Mn Units) Exhibit 6.50: Forecast of Latin America (in USD Bn) Exhibit 6.51: Forecast of Brazil (in USD Bn) Exhibit 6.52: Forecast of Argentina (in USD Bn) Exhibit 6.53: Forecast of Colombia (in USD Bn) Exhibit 6.54: Forecast of Rest of Latin America (in USD Bn) Exhibit 6.55: Forecast of Middle East and Africa (in USD Bn) Exhibit 6.56: Forecast of Saudi Arabia (in USD Bn) Exhibit 6.57: Forecast of United Arab Emirates (in USD Bn) Exhibit 6.58: Forecast of South Africa (in USD Bn) Exhibit 6.59: Forecast of Turkey (in USD Bn) Exhibit 6.60: Forecast of Rest of Middle East and Africa (in USD Bn) |
*If Applicable.

NAVADHI is a market research company that helps global firms differentiate themselves, break market entry barriers, track their investments, develop business strategies and plan for future by providing actionable market research intelligence that helps them succeed.