


The global industrial machinery and automation industry is estimated at US$1,192,029.8 million in 2025 and is forecast to reach US$1,591,930.3 million by 2031, a compound annual growth rate (CAGR) of 4.9% over 2025-2031. Volume is estimated at 931.7 million units in 2025, rising to 1,169.1 million units in 2031. Asia Pacific is the largest region at US$590,479.0 million (49.5% share) in 2025, and Construction & Mining Machinery is the largest equipment type at US$257,697.0 million (21.6% share).
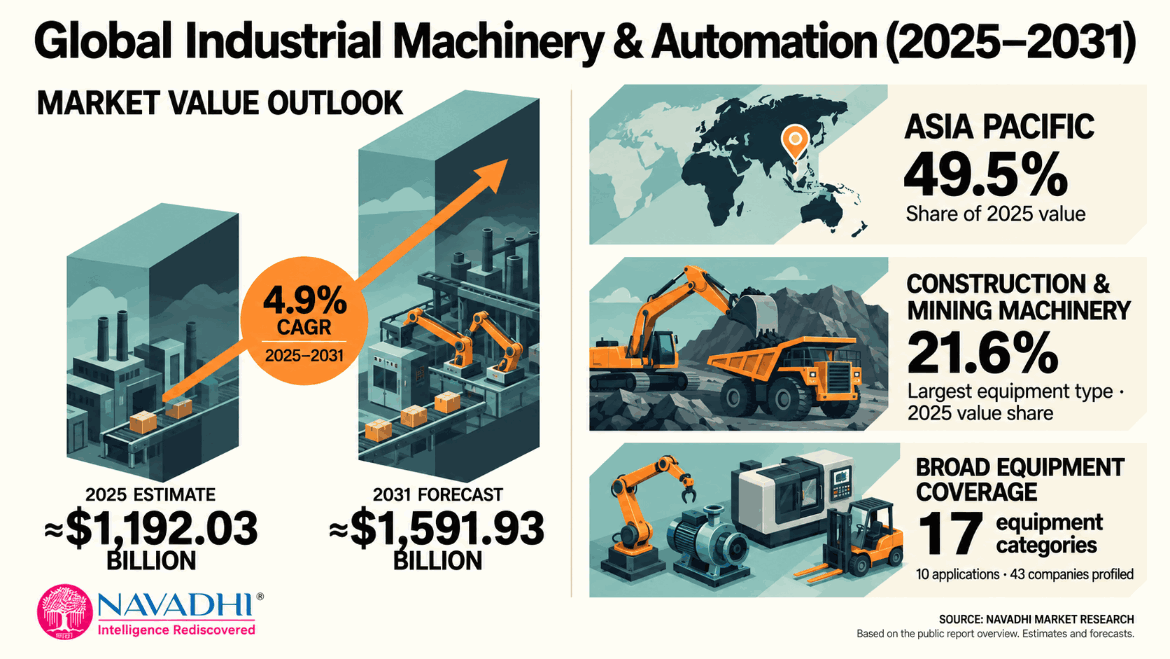
This is the parent report for industrial machinery: it covers 17 equipment categories, from industrial robots, machine tools, controllers, drives and motion control through pumps, valves, compressors, construction, mining and agricultural machinery, packaging, food and plastics processing machinery, to semiconductor manufacturing equipment and industrial trucks. Category-level reports, for example on pumps, can be derived from the type-level values and volumes. The estimate is built bottom-up from sourced unit counts and prices where they exist (IFR installations, SEMI billings, WITS industrial truck orders, trade-association statistics and company results) and the report rates each channel by evidence grade; confidence is stated as low, with a Monte Carlo 5th-95th percentile band of US$1,146,120 million to US$1,210,816 million.
Scope of the Global Industrial Machinery & Automation Industry Strategic Research Report
This report covers market value (US$ million) and volume (thousand units) for 2022-2031, with 2025 as the base year and 2026-2031 as the forecast period. It analyses 17 equipment types, ten end-use application verticals, five regions and country-level markets (23 named countries and groupings plus five rest-of-region groups), and profiles 43 companies across automation, machine tools, fluid handling, construction and agricultural equipment, packaging, intralogistics and semiconductor equipment. Where a figure could not be verified from a public source, the report says so and does not present it as fact.
Segment by Type
Segment by Application
Segment by Region
Companies Profiled
Siemens AG, ABB Ltd, Fanuc Corporation, Rockwell Automation, Inc., Mitsubishi Electric Corporation, Yaskawa Electric Corporation, Emerson Electric Co., Honeywell International Inc., Schneider Electric SE, Keyence Corporation, Omron Corporation, SMC Corporation, Shenzhen Inovance Technology Co., Ltd., Daifuku Co., Ltd., KION Group AG, DMG MORI Co., Ltd., TRUMPF SE + Co. KG, Stratasys Ltd., Danfoss A/S, Parker-Hannifin Corporation, Caterpillar Inc., Komatsu Ltd., Deere & Company, CNH Industrial N.V., AGCO Corporation, CLAAS KGaA mbH, Kubota Corporation, XCMG Group, Atlas Copco AB, Ingersoll Rand Inc., Xylem Inc., Flowserve Corporation, Sulzer Ltd, Grundfos Holding A/S, KSB SE & Co. KGaA, Ebara Corporation, GEA Group AG, Krones AG, Toyota Industries Corporation, Jungheinrich AG, Hyster-Yale, Inc., ASML Holding N.V., Applied Materials, Inc..
Who Can Use This Report?
| 1. Executive Summary 1.1 Market Definition and Scale 1.2 Primary Growth Drivers 1.3 Segment Highlights 1.4 Regional and Country Highlights 1.5 Competitive Structure and Corporate Developments 1.6 Principal Risks 1.7 Outlook 2. Industry Overview & Forecast 2.1 Market Definition and Scope 2.2 Market Size and Historical Performance 2.3 Forecast and Growth Logic 2.4 Volume Analysis 2.5 Value-Chain and Pricing Dynamics 3. Market Segmentation by Type 3.1 Overview of the Type Segmentation Framework 3.2 Volume Analysis 3.2.1 Global Equipment Volume, 2022–2031 3.2.2 Industrial Robots and Collaborative Robots (Cobots) 3.2.3 Machine Tools — Metal Cutting and Metal Forming 3.2.4 Programmable Logic Controllers and Distributed Control Systems 3.2.5 Conveyor and Material Handling Systems 3.2.6 Actuators 3.2.7 Drives and Motion Control Equipment 3.2.8 Industrial 3D Printing and Additive Manufacturing Systems 3.2.9 Pumps and Pumping Systems 3.2.10 Industrial Valves and Flow Control 3.2.11 Industrial Air and Gas Compressors 3.2.12 Construction and Mining Machinery 3.2.13 Agricultural Machinery and Equipment 3.2.14 Packaging Machinery 3.2.15 Food and Beverage Processing Machinery 3.2.16 Plastics and Rubber Processing Machinery 3.2.17 Semiconductor Manufacturing Equipment 3.2.18 Industrial Trucks and Forklifts 3.3 Comparative Mix-Shift Analysis 4. Market Segmentation by Application 4.1 Overview and Structural Context 4.1.1 Automotive and Transportation Equipment Manufacturing 4.1.2 Electronics and Semiconductor Fabrication 4.1.3 Food Agriculture and Beverage Production 4.1.4 Pharmaceutical and Medical Device Manufacturing 4.1.5 Metals and Heavy Engineering 4.1.6 Construction Mining and Infrastructure 4.1.7 Oil Gas Chemicals and Power Generation 4.1.8 Water and Wastewater Treatment 4.1.9 Logistics Warehousing and E-commerce Fulfillment 4.1.10 General Manufacturing Building Services and Other 4.2 Comparative Analysis of Application Segments 5. Regional Market Forecast 5.1 North America 5.1.1 Regional Overview 5.1.2 Key Growth Drivers 5.1.3 Regulatory & Infrastructure Landscape 5.1.4 Country-Level Analysis 5.1.5 Market Forecast 2025–2031 5.2 Europe 5.2.1 Regional Overview 5.2.2 Key Growth Drivers 5.2.3 Regulatory & Infrastructure Landscape 5.2.4 Country-Level Analysis 5.2.5 Market Forecast 2025–2031 5.3 Asia Pacific 5.3.1 Regional Overview 5.3.2 Key Growth Drivers 5.3.3 Regulatory & Infrastructure Landscape 5.3.4 Country-Level Analysis 5.3.5 Market Forecast 2025–2031 5.4 Latin America 5.4.1 Regional Overview 5.4.2 Key Growth Drivers 5.4.3 Regulatory & Infrastructure Landscape 5.4.4 Country-Level Analysis 5.4.5 Market Forecast 2025–2031 5.5 Middle East and Africa 5.5.1 Regional Overview 5.5.2 Key Growth Drivers 5.5.3 Regulatory & Infrastructure Landscape 5.5.4 Country-Level Analysis 5.5.5 Market Forecast 2025–2031 6. Country-Level Market Forecast 6.1 North America 6.1.1 United States 6.1.2 Canada 6.1.3 Mexico 6.1.4 Rest of North America 6.2 Europe 6.2.1 Germany 6.2.2 Italy 6.2.3 France 6.2.4 United Kingdom 6.2.5 Spain 6.2.6 Rest of Europe 6.3 Asia Pacific 6.3.1 China 6.3.2 Japan 6.3.3 India 6.3.4 South Korea 6.3.5 Taiwan 6.3.6 Southeast Asia 6.3.7 Rest of Asia Pacific 6.4 Latin America 6.4.1 Brazil 6.4.2 Argentina 6.4.3 Chile 6.4.4 Colombia 6.4.5 Rest of Latin America 6.5 Middle East and Africa 6.5.1 Turkey 6.5.2 Saudi Arabia 6.5.3 South Africa 6.5.4 United Arab Emirates 6.5.5 Egypt 6.5.6 Rest of Middle East and Africa 7. Growth Drivers & Inhibitors 7.1 Overview 7.2 Growth Drivers 7.2.1 Accelerating Factory Automation and Industrial Digitalisation 7.2.2 Semiconductor Capital Intensity and Electronics Supply Chain Expansion 7.2.3 Infrastructure Investment and Construction Activity in Emerging Markets 7.2.4 Energy Transition, Decarbonisation, and Industrial Fluid Management Demand 7.2.5 E-Commerce Fulfilment and Warehouse Automation Investment 7.2.6 Pharmaceutical and Food Safety Automation 7.3 Inhibitors 7.3.1 Cyclical Agricultural Machinery Downturn and Extended Recovery Timeline 7.3.2 European Industrial Contraction and Structural Competitiveness Erosion 7.3.3 Geopolitical Trade Friction, Tariff Exposure, and Supply Chain Disruption 7.3.4 Uneven Capital Expenditure and Delayed Investment Recovery in Core Automation 7.3.5 Additive Manufacturing Hardware Demand Compression and Market Maturity Concerns 7.4 Impact Assessment Matrix 7.5 Integrated Assessment 8. Key Company Profiles 8.1 Siemens AG 8.1.1 Company Overview 8.1.2 Key Products & Segments 8.1.3 Financial Performance (2023–2025) 8.1.4 Business Strategy 8.1.5 SWOT Analysis 8.1.6 Strategic Implications (2025–2031) 8.2 ABB Ltd 8.2.1 Company Overview 8.2.2 Key Products & Segments 8.2.3 Financial Performance (2023–2025) 8.2.4 Business Strategy 8.2.5 SWOT Analysis 8.2.6 Strategic Implications (2025–2031) 8.3 Fanuc Corporation 8.3.1 Company Overview 8.3.2 Key Products & Segments 8.3.3 Financial Performance (2023–2025) 8.3.4 Business Strategy 8.3.5 SWOT Analysis 8.3.6 Strategic Implications (2025–2031) 8.4 Rockwell Automation, Inc. 8.4.1 Company Overview 8.4.2 Key Products & Segments 8.4.3 Financial Performance (2023–2025) 8.4.4 Business Strategy 8.4.5 SWOT Analysis 8.4.6 Strategic Implications (2025–2031) 8.5 Mitsubishi Electric Corporation 8.5.1 Company Overview 8.5.2 Key Products & Segments 8.5.3 Financial Performance (2023–2025) 8.5.4 Business Strategy 8.5.5 SWOT Analysis 8.5.6 Strategic Implications (2025–2031) 8.6 Yaskawa Electric Corporation 8.6.1 Company Overview 8.6.2 Key Products & Segments 8.6.3 Financial Performance (2023–2025) 8.6.4 Business Strategy 8.6.5 SWOT Analysis 8.6.6 Strategic Implications (2025–2031) 8.7 Emerson Electric Co. 8.7.1 Company Overview 8.7.2 Key Products & Segments 8.7.3 Financial Performance (2023–2025) 8.7.4 Business Strategy 8.7.5 SWOT Analysis 8.7.6 Strategic Implications (2025–2031) 8.8 Honeywell International Inc. 8.8.1 Company Overview 8.8.2 Key Products & Segments 8.8.3 Financial Performance (2023–2025) 8.8.4 Business Strategy 8.8.5 SWOT Analysis 8.8.6 Strategic Implications (2025–2031) 8.9 Schneider Electric SE 8.9.1 Company Overview 8.9.2 Key Products & Segments 8.9.3 Financial Performance (2023–2025) 8.9.4 Business Strategy 8.9.5 SWOT Analysis 8.9.6 Strategic Implications (2025–2031) 8.10 Keyence Corporation 8.10.1 Company Overview 8.10.2 Key Products & Segments 8.10.3 Financial Performance (2023–2025) 8.10.4 Business Strategy 8.10.5 SWOT Analysis 8.10.6 Strategic Implications (2025–2031) 8.11 Omron Corporation 8.11.1 Company Overview 8.11.2 Key Products & Segments 8.11.3 Financial Performance (2023–2025) 8.11.4 Business Strategy 8.11.5 SWOT Analysis 8.11.6 Strategic Implications (2025–2031) 8.12 SMC Corporation 8.12.1 Company Overview 8.12.2 Key Products & Segments 8.12.3 Financial Performance (2023–2025) 8.12.4 Business Strategy 8.12.5 SWOT Analysis 8.12.6 Strategic Implications (2025–2031) 8.13 Shenzhen Inovance Technology Co., Ltd. 8.13.1 Company Overview 8.13.2 Key Products & Segments 8.13.3 Financial Performance (2023–2025) 8.13.4 Business Strategy 8.13.5 SWOT Analysis 8.13.6 Strategic Implications (2025–2031) 8.14 Daifuku Co., Ltd. 8.14.1 Company Overview 8.14.2 Key Products & Segments 8.14.3 Financial Performance (2023–2025) 8.14.4 Business Strategy 8.14.5 SWOT Analysis 8.14.6 Strategic Implications (2025–2031) 8.15 KION Group AG 8.15.1 Company Overview 8.15.2 Key Products & Segments 8.15.3 Financial Performance (2023–2025) 8.15.4 Business Strategy 8.15.5 SWOT Analysis 8.15.6 Strategic Implications (2025–2031) 8.16 DMG MORI Co., Ltd. 8.16.1 Company Overview 8.16.2 Key Products & Segments 8.16.3 Financial Performance (2023–2025) 8.16.4 Business Strategy 8.16.5 SWOT Analysis 8.16.6 Strategic Implications (2025–2031) 8.17 TRUMPF SE + Co. KG 8.17.1 Company Overview 8.17.2 Key Products & Segments 8.17.3 Financial Performance (2023–2025) 8.17.4 Business Strategy 8.17.5 SWOT Analysis 8.17.6 Strategic Implications (2025–2031) 8.18 Stratasys Ltd. 8.18.1 Company Overview 8.18.2 Key Products & Segments 8.18.3 Financial Performance (2023–2025) 8.18.4 Business Strategy 8.18.5 SWOT Analysis 8.18.6 Strategic Implications (2025–2031) 8.19 Danfoss A/S 8.19.1 Company Overview 8.19.2 Key Products & Segments 8.19.3 Financial Performance (2023–2025) 8.19.4 Business Strategy 8.19.5 SWOT Analysis 8.19.6 Strategic Implications (2025–2031) 8.20 Parker-Hannifin Corporation 8.20.1 Company Overview 8.20.2 Key Products & Segments 8.20.3 Financial Performance (2023–2025) 8.20.4 Business Strategy 8.20.5 SWOT Analysis 8.20.6 Strategic Implications (2025–2031) 8.21 Caterpillar Inc. 8.21.1 Company Overview 8.21.2 Key Products & Segments 8.21.3 Financial Performance (2023–2025) 8.21.4 Business Strategy 8.21.5 SWOT Analysis 8.21.6 Strategic Implications (2025–2031) 8.22 Komatsu Ltd. 8.22.1 Company Overview 8.22.2 Key Products & Segments 8.22.3 Financial Performance (2023–2025) 8.22.4 Business Strategy 8.22.5 SWOT Analysis 8.22.6 Strategic Implications (2025–2031) 8.23 Deere & Company 8.23.1 Company Overview 8.23.2 Key Products & Segments 8.23.3 Financial Performance (2023–2025) 8.23.4 Business Strategy 8.23.5 SWOT Analysis 8.23.6 Strategic Implications (2025–2031) 8.24 CNH Industrial N.V. 8.24.1 Company Overview 8.24.2 Key Products & Segments 8.24.3 Financial Performance (2023–2025) 8.24.4 Business Strategy 8.24.5 SWOT Analysis 8.24.6 Strategic Implications (2025–2031) 8.25 AGCO Corporation 8.25.1 Company Overview 8.25.2 Key Products & Segments 8.25.3 Financial Performance (2023–2025) 8.25.4 Business Strategy 8.25.5 SWOT Analysis 8.25.6 Strategic Implications (2025–2031) 8.26 CLAAS KGaA mbH 8.26.1 Company Overview 8.26.2 Key Products & Segments 8.26.3 Financial Performance (2023–2025) 8.26.4 Business Strategy 8.26.5 SWOT Analysis 8.26.6 Strategic Implications (2025–2031) 8.27 Kubota Corporation 8.27.1 Company Overview 8.27.2 Key Products & Segments 8.27.3 Financial Performance (2023–2025) 8.27.4 Business Strategy 8.27.5 SWOT Analysis 8.27.6 Strategic Implications (2025–2031) 8.28 XCMG Group 8.28.1 Company Overview 8.28.2 Key Products & Segments 8.28.3 Financial Performance (2023–2025) 8.28.4 Business Strategy 8.28.5 SWOT Analysis 8.28.6 Strategic Implications (2025–2031) 8.29 Atlas Copco AB 8.29.1 Company Overview 8.29.2 Key Products & Segments 8.29.3 Financial Performance (2023–2025) 8.29.4 Business Strategy 8.29.5 SWOT Analysis 8.29.6 Strategic Implications (2025–2031) 8.30 Ingersoll Rand Inc. 8.30.1 Company Overview 8.30.2 Key Products & Segments 8.30.3 Financial Performance (2023–2025) 8.30.4 Business Strategy 8.30.5 SWOT Analysis 8.30.6 Strategic Implications (2025–2031) 8.31 Xylem Inc. 8.31.1 Company Overview 8.31.2 Key Products & Segments 8.31.3 Financial Performance (2023–2025) 8.31.4 Business Strategy 8.31.5 SWOT Analysis 8.31.6 Strategic Implications (2025–2031) 8.32 Flowserve Corporation 8.32.1 Company Overview 8.32.2 Key Products & Segments 8.32.3 Financial Performance (2023–2025) 8.32.4 Business Strategy 8.32.5 SWOT Analysis 8.32.6 Strategic Implications (2025–2031) 8.33 Sulzer Ltd 8.33.1 Company Overview 8.33.2 Key Products & Segments 8.33.3 Financial Performance (2023–2025) 8.33.4 Business Strategy 8.33.5 SWOT Analysis 8.33.6 Strategic Implications (2025–2031) 8.34 Grundfos Holding A/S 8.34.1 Company Overview 8.34.2 Key Products & Segments 8.34.3 Financial Performance (2023–2025) 8.34.4 Business Strategy 8.34.5 SWOT Analysis 8.34.6 Strategic Implications (2025–2031) 8.35 KSB SE & Co. KGaA 8.35.1 Company Overview 8.35.2 Key Products & Segments 8.35.3 Financial Performance (2023–2025) 8.35.4 Business Strategy 8.35.5 SWOT Analysis 8.35.6 Strategic Implications (2025–2031) 8.36 Ebara Corporation 8.36.1 Company Overview 8.36.2 Key Products & Segments 8.36.3 Financial Performance (2023–2025) 8.36.4 Business Strategy 8.36.5 SWOT Analysis 8.36.6 Strategic Implications (2025–2031) 8.37 GEA Group AG 8.37.1 Company Overview 8.37.2 Key Products & Segments 8.37.3 Financial Performance (2023–2025) 8.37.4 Business Strategy 8.37.5 SWOT Analysis 8.37.6 Strategic Implications (2025–2031) 8.38 Krones AG 8.38.1 Company Overview 8.38.2 Key Products & Segments 8.38.3 Financial Performance (2023–2025) 8.38.4 Business Strategy 8.38.5 SWOT Analysis 8.38.6 Strategic Implications (2025–2031) 8.39 Toyota Industries Corporation 8.39.1 Company Overview 8.39.2 Key Products & Segments 8.39.3 Financial Performance (2023–2025) 8.39.4 Business Strategy 8.39.5 SWOT Analysis 8.39.6 Strategic Implications (2025–2031) 8.40 Jungheinrich AG 8.40.1 Company Overview 8.40.2 Key Products & Segments 8.40.3 Financial Performance (2023–2025) 8.40.4 Business Strategy 8.40.5 SWOT Analysis 8.40.6 Strategic Implications (2025–2031) 8.41 Hyster-Yale, Inc. 8.41.1 Company Overview 8.41.2 Key Products & Segments 8.41.3 Financial Performance (2023–2025) 8.41.4 Business Strategy 8.41.5 SWOT Analysis 8.41.6 Strategic Implications (2025–2031) 8.42 ASML Holding N.V. 8.42.1 Company Overview 8.42.2 Key Products & Segments 8.42.3 Financial Performance (2023–2025) 8.42.4 Business Strategy 8.42.5 SWOT Analysis 8.42.6 Strategic Implications (2025–2031) 8.43 Applied Materials, Inc. 8.43.1 Company Overview 8.43.2 Key Products & Segments 8.43.3 Financial Performance (2023–2025) 8.43.4 Business Strategy 8.43.5 SWOT Analysis 8.43.6 Strategic Implications (2025–2031) 9. Competitive Landscape 9.1 Competitive Landscape Overview 9.1.1 Scale and Scope of Profiled Participants 9.1.2 Why Concentration Cannot Be Measured at the Industry Level 9.1.3 Competitive Dynamics by Broad Arena 9.1.4 Overall Competitive Intensity Assessment 9.2 Competitive Intensity Assessment 9.2.1 Market Structure by Competitive Cohort 9.2.2 Capacity vs. Demand Dynamics 9.2.3 Pricing Environment 9.2.4 Barriers to Entry 9.2.5 Barriers to Exit 9.3 Key Player Strategies & Positioning 9.3.1 Strategic Group Architecture 9.3.2 Differentiation Strategies by Major Player 9.3.3 Geographic Strongholds 9.3.4 M&A and Partnership Activity (2022–Present) 9.3.5 R&D and Technology Investment Trends 9.4 Competitive Dynamics & Strategic Outlook 9.4.1 The Shifting Competitive Landscape 9.4.2 Emerging Competitive Threats 9.4.3 Consolidation vs. Fragmentation Outlook 9.4.4 Competitive Response Matrix 9.4.5 Strategic Recommendations for 2026–2031 10. Porter's Five Forces Analysis 10.1 Threat of New Entrants 10.2 Bargaining Power of Buyers 10.3 Bargaining Power of Suppliers 10.4 Threat of Substitutes 10.5 Competitive Rivalry 11. PESTLE Analysis 11.1 Overview 11.2 Political 11.3 Economic 11.4 Social 11.5 Technological 11.6 Legal and Regulatory 11.7 Environmental 11.8 PESTLE Summary Assessment 12. SWOT Analysis 12.1.1 Detailed Analysis 12.1.1.1 Strengths 12.1.1.2 Weaknesses 12.1.1.3 Opportunities 12.1.1.4 Threats 12.1.2 Strategic Implications 13. Future Trends & Outlook 13.1 Artificial Intelligence Integration Across the Automation Stack 13.2 Semiconductor Equipment as a Structural Growth Anchor 13.3 Supply Chain Regionalisation and Tariff-Driven Demand Fragmentation 13.4 Accelerated Robotics Adoption Driven by Labour Market Structural Deficits 13.5 Software-Defined Industrial Platforms and the Transition to Recurring Revenue 13.6 Electrification and Energy Efficiency as Competitive Differentiation 13.7 Chinese Domestic Champions Challenging Global Incumbents in Cost-Competitive Segments 13.8 Portfolio Rationalisation and M&A-Driven Capability Acquisition 13.9 Summary of Key Trends 13.10 Forward Outlook: 2026–2031 List of Exhibits Exhibit 2.1: Forecast of Global Market YoY Growth Rate & CAGR Summary (in %) Exhibit 2.2: Forecast of Global Market YoY Growth Rate & CAGR Summary (in %) Exhibit 2.3: Forecast of Global (in USD Bn) Exhibit 2.4: Forecast of North America (in USD Bn) Exhibit 2.5: Forecast of Europe (in USD Bn) Exhibit 2.6: Forecast of Asia Pacific (in USD Bn) Exhibit 2.7: Forecast of Latin America (in USD Bn) Exhibit 2.8: Forecast of Middle East and Africa (in USD Bn) Exhibit 2.9: Forecast of Global (in Th. Units) Exhibit 2.10: Forecast of North America (in Th. Units) Exhibit 2.11: Forecast of Europe (in Th. Units) Exhibit 2.12: Forecast of Asia Pacific (in Th. Units) Exhibit 2.13: Forecast of Latin America (in Th. Units) Exhibit 2.14: Forecast of Middle East and Africa (in Th. Units) Exhibit 3.15: Forecast of Industrial Robots & Collaborative Robots (Cobots) (in USD Bn) Exhibit 3.16: Forecast of Industrial Robots & Collaborative Robots (Cobots) (in Th. Units) Exhibit 3.17: Forecast of Machine Tools (Metal Cutting & Metal Forming) (in USD Bn) Exhibit 3.18: Forecast of Machine Tools (Metal Cutting & Metal Forming) (in Th. Units) Exhibit 3.19: Forecast of Segment Type (in USD Bn) Exhibit 3.20: Forecast of Segment Type (in Th. Units) Exhibit 3.21: Forecast of Conveyor & Material Handling Systems (in USD Bn) Exhibit 3.22: Forecast of Conveyor & Material Handling Systems (in Th. Units) Exhibit 3.23: Forecast of Actuators (in USD Bn) Exhibit 3.24: Forecast of Actuators (in Th. Units) Exhibit 3.25: Forecast of Drives & Motion Control Equipment (in USD Bn) Exhibit 3.26: Forecast of Drives & Motion Control Equipment (in Th. Units) Exhibit 3.27: Forecast of Industrial 3D Printing & Additive Manufacturing Systems (in USD Bn) Exhibit 3.28: Forecast of Industrial 3D Printing & Additive Manufacturing Systems (in Th. Units) Exhibit 3.29: Forecast of Pumps & Pumping Systems (in USD Bn) Exhibit 3.30: Forecast of Pumps & Pumping Systems (in Th. Units) Exhibit 3.31: Forecast of Industrial Valves & Flow Control (in USD Bn) Exhibit 3.32: Forecast of Industrial Valves & Flow Control (in Th. Units) Exhibit 3.33: Forecast of Industrial Air & Gas Compressors (in USD Bn) Exhibit 3.34: Forecast of Industrial Air & Gas Compressors (in Th. Units) Exhibit 3.35: Forecast of Construction & Mining Machinery (in USD Bn) Exhibit 3.36: Forecast of Construction & Mining Machinery (in Th. Units) Exhibit 3.37: Forecast of Agricultural Machinery & Equipment (in USD Bn) Exhibit 3.38: Forecast of Agricultural Machinery & Equipment (in Th. Units) Exhibit 3.39: Forecast of Packaging Machinery (in USD Bn) Exhibit 3.40: Forecast of Packaging Machinery (in Th. Units) Exhibit 3.41: Forecast of Food & Beverage Processing Machinery (in USD Bn) Exhibit 3.42: Forecast of Food & Beverage Processing Machinery (in Th. Units) Exhibit 3.43: Forecast of Plastics & Rubber Processing Machinery (in USD Bn) Exhibit 3.44: Forecast of Plastics & Rubber Processing Machinery (in Th. Units) Exhibit 3.45: Forecast of Semiconductor Manufacturing Equipment (in USD Bn) Exhibit 3.46: Forecast of Semiconductor Manufacturing Equipment (in Th. Units) Exhibit 3.47: Forecast of Industrial Trucks & Forklifts (in USD Bn) Exhibit 3.48: Forecast of Industrial Trucks & Forklifts (in Th. Units) Exhibit 4.49: Forecast of Automotive & Transportation Equipment Manufacturing (in USD Bn) Exhibit 4.50: Forecast of Automotive & Transportation Equipment Manufacturing (in Th. Units) Exhibit 4.51: Forecast of Electronics & Semiconductor Fabrication (in USD Bn) Exhibit 4.52: Forecast of Electronics & Semiconductor Fabrication (in Th. Units) Exhibit 4.53: Forecast of Food Agriculture & Beverage Production (in USD Bn) Exhibit 4.54: Forecast of Food Agriculture & Beverage Production (in Th. Units) Exhibit 4.55: Forecast of Pharmaceutical & Medical Device Manufacturing (in USD Bn) Exhibit 4.56: Forecast of Pharmaceutical & Medical Device Manufacturing (in Th. Units) Exhibit 4.57: Forecast of Metals & Heavy Engineering (in USD Bn) Exhibit 4.58: Forecast of Metals & Heavy Engineering (in Th. Units) Exhibit 4.59: Forecast of Construction Mining & Infrastructure (in USD Bn) Exhibit 4.60: Forecast of Construction Mining & Infrastructure (in Th. Units) Exhibit 4.61: Forecast of Oil Gas Chemicals & Power Generation (in USD Bn) Exhibit 4.62: Forecast of Oil Gas Chemicals & Power Generation (in Th. Units) Exhibit 4.63: Forecast of Water & Wastewater Treatment (in USD Bn) Exhibit 4.64: Forecast of Water & Wastewater Treatment (in Th. Units) Exhibit 4.65: Forecast of Logistics Warehousing & E-commerce Fulfillment (in USD Bn) Exhibit 4.66: Forecast of Logistics Warehousing & E-commerce Fulfillment (in Th. Units) Exhibit 4.67: Forecast of General Manufacturing Building Services & Other (in USD Bn) Exhibit 4.68: Forecast of General Manufacturing Building Services & Other (in Th. Units) Exhibit 6.69: Forecast of North America (in USD Bn) Exhibit 6.70: Forecast of United States (in USD Bn) Exhibit 6.71: Forecast of Canada (in USD Bn) Exhibit 6.72: Forecast of Mexico (in USD Bn) Exhibit 6.73: Forecast of Rest of North America (in USD Bn) Exhibit 6.74: Forecast of North America (in Th. Units) Exhibit 6.75: Forecast of United States (in Th. Units) Exhibit 6.76: Forecast of Canada (in Th. Units) Exhibit 6.77: Forecast of Mexico (in Th. Units) Exhibit 6.78: Forecast of Rest of North America (in Th. Units) Exhibit 6.79: Forecast of Europe (in USD Bn) Exhibit 6.80: Forecast of Germany (in USD Bn) Exhibit 6.81: Forecast of Italy (in USD Bn) Exhibit 6.82: Forecast of France (in USD Bn) Exhibit 6.83: Forecast of United Kingdom (in USD Bn) Exhibit 6.84: Forecast of Spain (in USD Bn) Exhibit 6.85: Forecast of Rest of Europe (in USD Bn) Exhibit 6.86: Forecast of Europe (in Th. Units) Exhibit 6.87: Forecast of Germany (in Th. Units) Exhibit 6.88: Forecast of Italy (in Th. Units) Exhibit 6.89: Forecast of France (in Th. Units) Exhibit 6.90: Forecast of United Kingdom (in Th. Units) Exhibit 6.91: Forecast of Spain (in Th. Units) Exhibit 6.92: Forecast of Rest of Europe (in Th. Units) Exhibit 6.93: Forecast of Asia Pacific (in USD Bn) Exhibit 6.94: Forecast of China (in USD Bn) Exhibit 6.95: Forecast of Japan (in USD Bn) Exhibit 6.96: Forecast of India (in USD Bn) Exhibit 6.97: Forecast of South Korea (in USD Bn) Exhibit 6.98: Forecast of Taiwan (in USD Bn) Exhibit 6.99: Forecast of Southeast Asia (in USD Bn) Exhibit 6.100: Forecast of Rest of Asia Pacific (in USD Bn) Exhibit 6.101: Forecast of Asia Pacific (in Th. Units) Exhibit 6.102: Forecast of China (in Th. Units) Exhibit 6.103: Forecast of Japan (in Th. Units) Exhibit 6.104: Forecast of India (in Th. Units) Exhibit 6.105: Forecast of South Korea (in Th. Units) Exhibit 6.106: Forecast of Taiwan (in Th. Units) Exhibit 6.107: Forecast of Southeast Asia (in Th. Units) Exhibit 6.108: Forecast of Rest of Asia Pacific (in Th. Units) Exhibit 6.109: Forecast of Latin America (in USD Bn) Exhibit 6.110: Forecast of Brazil (in USD Bn) Exhibit 6.111: Forecast of Argentina (in USD Bn) Exhibit 6.112: Forecast of Chile (in USD Bn) Exhibit 6.113: Forecast of Colombia (in USD Bn) Exhibit 6.114: Forecast of Rest of Latin America (in USD Bn) Exhibit 6.115: Forecast of Latin America (in Th. Units) Exhibit 6.116: Forecast of Brazil (in Th. Units) Exhibit 6.117: Forecast of Argentina (in Th. Units) Exhibit 6.118: Forecast of Chile (in Th. Units) Exhibit 6.119: Forecast of Colombia (in Th. Units) Exhibit 6.120: Forecast of Rest of Latin America (in Th. Units) Exhibit 6.121: Forecast of Middle East and Africa (in USD Bn) Exhibit 6.122: Forecast of Turkey (in USD Bn) Exhibit 6.123: Forecast of Saudi Arabia (in USD Bn) Exhibit 6.124: Forecast of South Africa (in USD Bn) Exhibit 6.125: Forecast of United Arab Emirates (in USD Bn) Exhibit 6.126: Forecast of Egypt (in USD Bn) Exhibit 6.127: Forecast of Rest of Middle East and Africa (in USD Bn) Exhibit 6.128: Forecast of Middle East and Africa (in Th. Units) Exhibit 6.129: Forecast of Turkey (in Th. Units) Exhibit 6.130: Forecast of Saudi Arabia (in Th. Units) Exhibit 6.131: Forecast of South Africa (in Th. Units) Exhibit 6.132: Forecast of United Arab Emirates (in Th. Units) Exhibit 6.133: Forecast of Egypt (in Th. Units) Exhibit 6.134: Forecast of Rest of Middle East and Africa (in Th. Units) |
*If Applicable.

NAVADHI is a market research company that helps global firms differentiate themselves, break market entry barriers, track their investments, develop business strategies and plan for future by providing actionable market research intelligence that helps them succeed.