
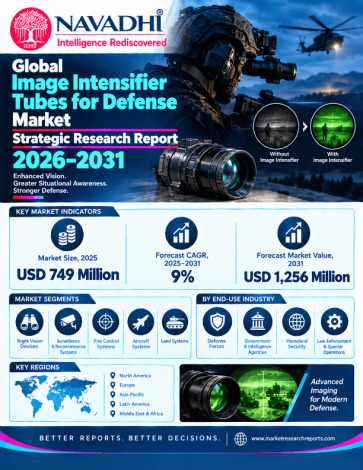

The global defense image intensifier tubes market is valued at approximately USD 749 million in 2025 and is projected to reach about USD 1.26 billion by 2031, a compound annual growth rate of 9.0%. The report sizes the tube itself, the photocathode, microchannel plate and phosphor screen that sit inside night-vision goggles, binoculars, weapon sights, vehicle and aircraft systems, and segments it by tube generation, phosphor type, performance specification and host platform.
Demand is driven by the shift from monocular to binocular goggles, which roughly doubles the tubes needed per unit, by multi-year procurement such as the German-led order for 100,000 Mikron binoculars (200,000 tubes, delivering 2027 to 2029) and the US Army and Marine Corps white-phosphor Gen 3 programs, and by NATO members that remain below a one-goggle-per-soldier target. Tube makers are adding capacity in Europe and the United States, and unfilmed Gen 3 tubes and next-generation Gen 2+ tubes are gaining share from standard grades.
North America holds the largest share of 2025 value; the largest non-US tube supplier puts the United States at 45% of the world market, supplied by two US tube makers, while Europe is the fastest-growing region on rearmament. The same supplier states a share of about 42% of the world market, and about 71% outside the US; smaller producers operate in Germany, Russia, China and India. The report covers 10 companies across 24 named countries in five regions, with a full 2022 to 2031 value series for every tube generation, host platform, region and country, plus green versus white phosphor and resolution-tier segmentation in Chapter 3.
Scope of the Global Image Intensifier Tubes for Defense Market Strategic Research Report
This report provides market sizing across tube-generation, phosphor-type, performance-specification and host-platform segments, regional and country splits, a competitive landscape of 10 profiled companies, and forecast analysis for 2025-2031.
Segment by Type (Tube Generation)
Segment by Phosphor Type
Segment by Performance Specification (Limiting Resolution)
Segment by Application (Host Platform)
Who Can Use This Report?
Night-vision device makers and system integrators choosing tube suppliers; tube manufacturers and component suppliers; defense ministries and procurement agencies benchmarking programs; investors assessing a concentrated, capacity-constrained supply base; and export-control, supply-chain and strategy teams.
| 1. Executive Summary 1.1 Market Synopsis 1.2 Key Findings 1.3 Market Size Methodology and Estimate Reconciliation 2. Industry Overview & Forecast 2.1 Market Definition and Scope 2.2 Market Value Forecast, 2025-2031 2.2.1 Basis of the Base-Year Estimate 2.2.2 Value by Region 2.2.3 Value by Tube Generation 2.2.4 Value by Host Platform 2.2.5 Supplementary Cuts: Phosphor Color and Resolution Tier 2.3 Historical Market Review, 2022-2025 2.4 Scenario Analysis (Base, Bull, Bear Cases) 2.4.1 Growth Drivers Underpinning the Forecast 2.5 Technology Landscape 2.6 Supply Chain, Export Controls and Gallium Dependence 3. Market Segmentation by Type 3.1 Market Segmentation by Type 3.1.1 Market by Type Overview 3.1.2 Gen 2 and Gen 2 Plus Tubes 3.1.3 Gen 3 Filmed Tubes 3.1.4 Gen 3 Filmless Tubes 3.1.5 Gen 0 and Gen 1 Legacy Tubes 3.1.6 Type Segment Outlook and Implications 3.2 Market Segmentation by Phosphor Type 3.2.1 Market by Phosphor Type Overview 3.2.2 Green Phosphor P43 Tubes 3.2.3 White Phosphor P45 Tubes 3.2.4 Phosphor Outlook and Analytical Caveats 3.3 Market Segmentation by Performance Specification 3.3.1 Market by Resolution Tier Overview 3.3.2 Entry Tier, Below 64 lp per mm 3.3.3 Mid Tier, 64 to 71 lp per mm 3.3.4 High Tier, 72 to 80 lp per mm 3.3.5 Top Tier, 81 lp per mm and Above 3.3.6 Performance Outlook and Analytical Caveats 4. Market Segmentation by Application 4.1 Market Segmentation by Application 4.1.1 Market by Application Overview 4.1.2 Soldier-Worn Goggles and Binoculars 4.1.3 Weapon Sights and Clip-On Systems 4.1.4 Handheld Monoculars and Surveillance Devices 4.1.5 Ground Vehicle Systems 4.1.6 Aviation Systems 4.1.7 Naval, Border Security and Other Platforms 4.1.8 Application Outlook and Analyst View 5. Regional Market Forecast North America Europe Asia Pacific Middle East & Africa Latin America 6. Country-Level Market Forecast 6.1 North America 6.1.1 United States 6.1.2 Canada 6.1.3 Mexico 6.2 Europe 6.2.1 Germany 6.2.2 United Kingdom 6.2.3 France 6.2.4 Italy 6.2.5 Poland 6.2.6 Russia 6.2.7 Rest of Europe 6.3 Asia Pacific 6.3.1 China 6.3.2 Japan 6.3.3 South Korea 6.3.4 India 6.3.5 Australia 6.3.6 Southeast Asia 6.3.7 Rest of Asia Pacific 6.4 Middle East & Africa 6.4.1 Saudi Arabia 6.4.2 United Arab Emirates 6.4.3 Israel 6.4.4 Turkiye 6.4.5 Egypt 6.4.6 South Africa 6.4.7 Rest of Middle East & Africa 6.5 Latin America 6.5.1 Brazil 6.5.2 Colombia 6.5.3 Argentina 6.5.4 Rest of Latin America 7. Growth Drivers & Inhibitors 7.1 Market Drivers 7.1.1 Monocular-to-Binocular Conversion 7.1.2 Large Multi-Year Procurement Programs 7.1.3 Capacity Additions by Principal Producers 7.1.4 Performance Upgrades and Product Cycles 7.1.5 Rising Defense Budgets and Regional Modernization 7.2 Market Restraints 7.2.1 Concentrated and Capacity-Constrained Supply 7.2.2 Export Controls and Sourcing Rules 7.2.3 Competing Technologies 7.2.4 Long Qualification and Procurement Cycles 7.3 Market Challenges and Data Considerations 7.4 Impact Assessment 7.5 Opportunities and White-Space Analysis 7.6 Analyst Perspective 8. Key Company Profiles 8.1 Exosens SA 8.1.1 Company Overview 8.1.2 Key Products & Segments 8.1.3 Financial Performance (2023–2025) 8.1.4 Business Strategy 8.1.5 SWOT Analysis 8.1.6 Strategic Implications (2025–2031) 8.2 L3Harris Technologies, Inc. 8.2.1 Company Overview 8.2.2 Key Products & Segments 8.2.3 Financial Performance (2023–2025) 8.2.4 Business Strategy 8.2.5 SWOT Analysis 8.2.6 Strategic Implications (2025–2031) 8.3 Elbit Systems Ltd. 8.3.1 Company Overview 8.3.2 Key Products & Segments 8.3.3 Financial Performance (2023–2025) 8.3.4 Business Strategy 8.3.5 SWOT Analysis 8.3.6 Strategic Implications (2025–2031) 8.4 Theon International plc 8.4.1 Company Overview 8.4.2 Key Products & Segments 8.4.3 Financial Performance (2023–2025) 8.4.4 Business Strategy 8.4.5 SWOT Analysis 8.4.6 Strategic Implications (2025–2031) 8.5 HARDER digital GmbH 8.5.1 Company Overview 8.5.2 Key Products & Segments 8.5.3 Financial Performance (2023–2025) 8.5.4 Business Strategy 8.5.5 SWOT Analysis 8.5.6 Strategic Implications (2025–2031) 8.6 JSC Katod 8.6.1 Company Overview 8.6.2 Key Products & Segments 8.6.3 Financial Performance (2023–2025) 8.6.4 Business Strategy 8.6.5 SWOT Analysis 8.6.6 Strategic Implications (2025–2031) 8.7 North Night Vision Technology Co., Ltd. 8.7.1 Company Overview 8.7.2 Key Products & Segments 8.7.3 Financial Performance (2023–2025) 8.7.4 Business Strategy 8.7.5 SWOT Analysis 8.7.6 Strategic Implications (2025–2031) 8.8 BEL Optronic Devices Limited 8.8.1 Company Overview 8.8.2 Key Products & Segments 8.8.3 Financial Performance (2023–2025) 8.8.4 Business Strategy 8.8.5 SWOT Analysis 8.8.6 Strategic Implications (2025–2031) 8.9 HENSOLDT Optronics GmbH 8.9.1 Company Overview 8.9.2 Key Products & Segments 8.9.3 Financial Performance (2023–2025) 8.9.4 Business Strategy 8.9.5 SWOT Analysis 8.9.6 Strategic Implications (2025–2031) 8.10 Newcon Optik 8.10.1 Company Overview 8.10.2 Key Products & Segments 8.10.3 Financial Performance (2023–2025) 8.10.4 Business Strategy 8.10.5 SWOT Analysis 8.10.6 Strategic Implications (2025–2031) 9. Competitive Landscape 9.1 Competitive Landscape Overview 9.2 Competitive Intensity Assessment 9.3 Key Player Strategies & Positioning 9.4 Competitive Dynamics & Strategic Outlook 9.4.1 Emerging Competitive Threats 9.4.2 Consolidation versus Fragmentation 9.4.3 Competitive Response Matrix 9.4.4 Strategic Outlook and Recommendations, 2026-2031 10. Porter's Five Forces Analysis 10.1 Threat of New Entrants 10.2 Bargaining Power of Buyers 10.3 Bargaining Power of Suppliers 10.4 Threat of Substitutes 10.5 Competitive Rivalry 11. PESTLE Analysis 11.1 PESTLE Analysis 11.1.1 Political 11.1.2 Economic 11.1.3 Social 11.1.4 Technological 11.1.5 Legal and Regulatory 11.1.6 Environmental 11.1.7 Overall PESTLE Implications 12. SWOT Analysis 13. Future Trends & Outlook 13.1 Unfilmed Gen 3 and Next-Generation Tube Transition 13.1.1 Technology Shift Overview 13.1.2 Segment Share Dynamics 13.1.3 Classification and Procurement Implications 13.1.4 Phosphor Color and Resolution Tier Evolution 13.1.5 Supply Capacity as the Binding Constraint 13.2 Binocular and Panoramic Goggle Adoption 13.2.1 The Monocular-to-Binocular Multiplier 13.2.2 Anchor Programs Defining the Demand Base 13.2.3 Platform Segment Implications 13.2.4 Competing Technology Assessment 13.3 Regional Sovereign Supply 13.3.1 Structural Realignment of Supply 13.3.2 Drivers of Sovereign Supply Programs 13.3.3 Regional Outlook 13.3.4 Sovereign Capability Opportunities 13.4 Long-Term Market Outlook (2032-2035) 13.4.1 Extension of the Base Case 13.4.2 Scenario Framework 13.4.3 Structural Themes Beyond 2031 13.4.4 Data and Disclosure Caveats 13.5 Investment & M&A Activity Outlook 13.5.1 Industry Structure and Investability 13.5.2 Investment Themes 13.5.3 M&A Considerations 13.5.4 Strategic Recommendations for Stakeholders 13.6 Summary Outlook List of Exhibits Exhibit 2.1: Forecast of Global Market YoY Growth Rate & CAGR Summary (in %) Exhibit 2.2: Forecast of Global (in USD Mn) Exhibit 2.3: Forecast of North America (in USD Mn) Exhibit 2.4: Forecast of Europe (in USD Mn) Exhibit 2.5: Forecast of Asia Pacific (in USD Mn) Exhibit 2.6: Forecast of Middle East & Africa (in USD Mn) Exhibit 2.7: Forecast of Latin America (in USD Mn) Exhibit 3.8: Forecast of Gen 2 and Gen 2 Plus Tubes (in USD Mn) Exhibit 3.9: Forecast of Gen 3 Filmed Tubes (in USD Mn) Exhibit 3.10: Forecast of Gen 3 Filmless Tubes (in USD Mn) Exhibit 3.11: Forecast of Gen 0 and Gen 1 Legacy Tubes (in USD Mn) Exhibit 4.12: Forecast of Soldier-Worn Goggles and Binoculars (in USD Mn) Exhibit 4.13: Forecast of Weapon Sights and Clip-On Systems (in USD Mn) Exhibit 4.14: Forecast of Handheld Monoculars and Surveillance Devices (in USD Mn) Exhibit 4.15: Forecast of Ground Vehicle Systems (in USD Mn) Exhibit 4.16: Forecast of Aviation Systems (in USD Mn) Exhibit 4.17: Forecast of Naval Border Security and Other Platforms (in USD Mn) Exhibit 6.18: Forecast of North America (in USD Mn) Exhibit 6.19: Forecast of United States (in USD Mn) Exhibit 6.20: Forecast of Canada (in USD Mn) Exhibit 6.21: Forecast of Mexico (in USD Mn) Exhibit 6.22: Forecast of Europe (in USD Mn) Exhibit 6.23: Forecast of Germany (in USD Mn) Exhibit 6.24: Forecast of United Kingdom (in USD Mn) Exhibit 6.25: Forecast of France (in USD Mn) Exhibit 6.26: Forecast of Italy (in USD Mn) Exhibit 6.27: Forecast of Poland (in USD Mn) Exhibit 6.28: Forecast of Russia (in USD Mn) Exhibit 6.29: Forecast of Rest of Europe (in USD Mn) Exhibit 6.30: Forecast of Asia Pacific (in USD Mn) Exhibit 6.31: Forecast of China (in USD Mn) Exhibit 6.32: Forecast of Japan (in USD Mn) Exhibit 6.33: Forecast of South Korea (in USD Mn) Exhibit 6.34: Forecast of India (in USD Mn) Exhibit 6.35: Forecast of Australia (in USD Mn) Exhibit 6.36: Forecast of Southeast Asia (in USD Mn) Exhibit 6.37: Forecast of Rest of Asia Pacific (in USD Mn) Exhibit 6.38: Forecast of Middle East & Africa (in USD Mn) Exhibit 6.39: Forecast of Saudi Arabia (in USD Mn) Exhibit 6.40: Forecast of United Arab Emirates (in USD Mn) Exhibit 6.41: Forecast of Israel (in USD Mn) Exhibit 6.42: Forecast of Turkiye (in USD Mn) Exhibit 6.43: Forecast of Egypt (in USD Mn) Exhibit 6.44: Forecast of South Africa (in USD Mn) Exhibit 6.45: Forecast of Rest of Middle East & Africa (in USD Mn) Exhibit 6.46: Forecast of Latin America (in USD Mn) Exhibit 6.47: Forecast of Brazil (in USD Mn) Exhibit 6.48: Forecast of Colombia (in USD Mn) Exhibit 6.49: Forecast of Argentina (in USD Mn) Exhibit 6.50: Forecast of Rest of Latin America (in USD Mn) |
*If Applicable.

NAVADHI is a market research company that helps global firms differentiate themselves, break market entry barriers, track their investments, develop business strategies and plan for future by providing actionable market research intelligence that helps them succeed.