
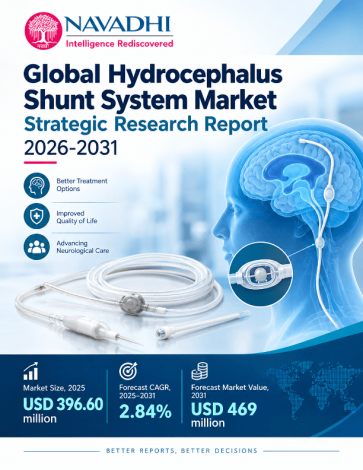

The global hydrocephalus shunt system market is valued at US$396.6 million in 2025 and is forecast to reach US$469.0 million by 2031, a compound annual growth rate (CAGR) of 2.8% over 2025-2031. Procedure volume (new placements and revisions) is estimated at about 342.1 thousand in 2025, rising to about 417.4 thousand by 2031. Published third-party estimates for this market range from about US$330 million to several billion US dollars because definitions and methods differ, so the report states its scope and triangulates a US$396.6 million base.
A hydrocephalus shunt system diverts excess cerebrospinal fluid from the brain to another part of the body and is implanted in infants, children and adults, including adults with normal pressure hydrocephalus (NPH). The scope covers adjustable (programmable) and fixed-pressure valve shunt systems and their catheters across new placements and revisions. Endoscopic procedures, external drainage and monitoring-only devices are outside the core market definition.
Scope of the Global Hydrocephalus Shunt System Market Strategic Research Report
This report covers market value (US$ million) and procedure volume (thousand units) for 2022-2031, with 2025 as the base year and 2026-2031 as the forecast period. It analyses valve-type and application segments, five regions and 33 countries, ten profiled companies, competitive structure, Porter's Five Forces, PESTLE, SWOT and future trends. No company discloses shunt-specific revenue, so the report presents verified company facts and does not state company market shares or concentration ratios.
Segment by Type
Segment by Application
Who Can Use This Report?
1. Executive Summary
1.1.1 Market Definition and Sizing
1.1.2 Principal Growth Drivers
1.1.3 Segment Highlights
1.1.4 Regional and Country Performance
1.1.5 Competitive Structure and Pipeline Activity
1.1.6 Principal Risks and Restraints
1.1.7 Outlook
2. Industry Overview & Forecast
2.1 Market Definition and Scope
2.2 Market Size and Historical Performance
2.3 Forecast and Growth Logic
2.4 Volume Analysis
2.5 Value-Chain and Pricing Dynamics
3. Market Segmentation by Type
3.1 Overview of the Type Segmentation Framework
3.2 Volume Analysis
3.2.1 Global Procedure Volume, 2022–2031
3.3 Adjustable (Programmable) Valve Shunt Systems
3.3.1 Definition, Mechanism, and Clinical Applications
3.3.2 Market Size, Share, and Historical Trajectory
3.3.3 Forecast to 2031 and CAGR
3.3.4 Demand Drivers
3.3.5 Technology and Pricing Dynamics
3.3.6 Key Suppliers and Competitive Positioning
3.3.7 Risks to the Forecast
3.4 Fixed-Pressure Valve Shunt Systems
3.4.1 Definition, Mechanism, and Clinical Applications
3.4.2 Market Size, Share, and Historical Trajectory
3.4.3 Forecast to 2031 and CAGR
3.4.4 Demand Drivers
3.4.5 Technology and Pricing Dynamics
3.4.6 Key Suppliers and Competitive Positioning
3.4.7 Risks to the Forecast
3.5 Comparative Analysis
4. Market Segmentation by Application
4.1 Overview of the Application Landscape
4.1.1 Pediatric Hydrocephalus (Congenital and Acquired)
4.1.2 Adult Acquired Hydrocephalus (Haemorrhage, Trauma, Tumour, Infection)
4.1.3 Normal Pressure Hydrocephalus (Adult)
4.1.4 Comparative Segment Assessment
5. Regional Market Forecast
5.1 North America
5.1.1 Regional Overview
5.1.2 Key Growth Drivers
5.1.3 Regulatory & Infrastructure Landscape
5.1.4 Country-Level Analysis
5.1.5 Market Forecast 2025–2031
5.2 Europe
5.2.1 Regional Overview
5.2.2 Key Growth Drivers
5.2.3 Regulatory & Infrastructure Landscape
5.2.4 Country-Level Analysis
5.2.5 Market Forecast 2025–2031
5.3 Asia Pacific
5.3.1 Regional Overview
5.3.2 Key Growth Drivers
5.3.3 Regulatory & Infrastructure Landscape
5.3.4 Country-Level Analysis
5.3.5 Market Forecast 2025–2031
5.4 Latin America
5.4.1 Regional Overview
5.4.2 Key Growth Drivers
5.4.3 Regulatory & Infrastructure Landscape
5.4.4 Country-Level Analysis
5.4.5 Market Forecast 2025–2031
5.5 Middle East and Africa
5.5.1 Regional Overview
5.5.2 Key Growth Drivers
5.5.3 Regulatory & Infrastructure Landscape
5.5.4 Country-Level Analysis
5.5.5 Market Forecast 2025–2031
6. Country-Level Market Forecast
6.1 North America
6.1.1 United States
6.1.2 Canada
6.1.3 Mexico
6.1.4 Rest of North America
6.2 Europe
6.2.1 Germany
6.2.2 United Kingdom
6.2.3 France
6.2.4 Italy
6.2.5 Spain
6.2.6 Russia
6.2.7 Rest of Europe
6.3 Asia Pacific
6.3.1 Japan
6.3.2 China
6.3.3 South Korea
6.3.4 India
6.3.5 Australia
6.3.6 Rest of Asia Pacific
6.4 Latin America
6.4.1 Brazil
6.4.2 Argentina
6.4.3 Colombia
6.4.4 Chile
6.4.5 Rest of Latin America
6.5 Middle East and Africa
6.5.1 GCC Countries
6.5.2 Turkey
6.5.3 Israel
6.5.4 South Africa
6.5.5 Egypt
6.5.6 Rest of Middle East and Africa
7. Growth Drivers & Inhibitors
7.1 Strategic Context
7.2 Growth Drivers
7.3 Growth Inhibitors
7.4 Impact Assessment Summary
7.5 Integrated Assessment
8. Key Company Profiles
8.1 Medtronic plc
8.1.1 Company Overview
8.1.2 Key Products & Segments
8.1.3 Financial Performance (2023–2025)
8.1.4 Business Strategy
8.1.5 SWOT Analysis
8.1.6 Strategic Implications (2025–2031)
8.2 Integra LifeSciences
8.2.1 Company Overview
8.2.2 Key Products & Segments
8.2.3 Financial Performance (2023–2025)
8.2.4 Business Strategy
8.2.5 SWOT Analysis
8.2.6 Strategic Implications (2025–2031)
8.3 B. Braun (Aesculap) with Christoph Miethke GmbH
8.3.1 Company Overview
8.3.2 Key Products & Segments
8.3.3 Financial Performance (2023–2025)
8.3.4 Business Strategy
8.3.5 SWOT Analysis
8.3.6 Strategic Implications (2025–2031)
8.4 Sophysa
8.4.1 Company Overview
8.4.2 Key Products & Segments
8.4.3 Financial Performance (2023–2025)
8.4.4 Business Strategy
8.4.5 SWOT Analysis
8.4.6 Strategic Implications (2025–2031)
8.5 Anuncia Medical
8.5.1 Company Overview
8.5.2 Key Products & Segments
8.5.3 Financial Performance (2023–2025)
8.5.4 Business Strategy
8.5.5 SWOT Analysis
8.5.6 Strategic Implications (2025–2031)
8.6 CereVasc, Inc.
8.6.1 Company Overview
8.6.2 Key Products & Segments
8.6.3 Financial Performance (2023–2025)
8.6.4 Business Strategy
8.6.5 SWOT Analysis
8.6.6 Strategic Implications (2025–2031)
8.7 Madison Scientific
8.7.1 Company Overview
8.7.2 Key Products & Segments
8.7.3 Financial Performance (2023–2025)
8.7.4 Business Strategy
8.7.5 SWOT Analysis
8.7.6 Strategic Implications (2025–2031)
8.8 Rhaeos, Inc.
8.8.1 Company Overview
8.8.2 Key Products & Segments
8.8.3 Financial Performance (2023–2025)
8.8.4 Business Strategy
8.8.5 SWOT Analysis
8.8.6 Strategic Implications (2025–2031)
8.9 Spiegelberg GmbH & Co. KG
8.9.1 Company Overview
8.9.2 Key Products & Segments
8.9.3 Financial Performance (2023–2025)
8.9.4 Business Strategy
8.9.5 SWOT Analysis
8.9.6 Strategic Implications (2025–2031)
8.10 Natus Medical Incorporated
8.10.1 Company Overview
8.10.2 Key Products & Segments
8.10.3 Financial Performance (2023–2025)
8.10.4 Business Strategy
8.10.5 SWOT Analysis
8.10.6 Strategic Implications (2025–2031)
9. Competitive Landscape
9.1 Competitive Landscape Overview
9.1.1 Market Structure and Concentration
9.1.2 Profiled Companies: Verified Facts (No Share Estimates)
9.1.3 Competitive Intensity Assessment
9.2 Competitive Intensity Assessment
9.2.1 Tier Structure (Qualitative)
9.2.2 Tier 1: Medtronic and Integra
9.2.3 Tier 2: B. Braun / Miethke and Sophysa
9.2.4 Tier 3 and Pre-Commercial Players
9.2.5 Capacity vs. Demand Dynamics
9.2.6 Pricing Environment
9.2.7 Barriers to Entry and Exit
9.3 Key Player Strategies & Positioning
9.3.1 Strategic Group Architecture
9.3.2 Differentiation Strategies by Major Player
9.3.3 Geographic Strongholds
9.3.4 M&A and Partnership Activity, 2022–Present
9.3.5 R&D and Technology Investment Trends
9.4 Competitive Dynamics & Strategic Outlook
9.4.1 Setting the Competitive Stage
9.4.2 Incumbent Competitive Positions
9.4.3 Emerging Competitive Threats
9.4.3.1 Endovascular Substitution: CereVasc eShunt
9.4.3.2 Sensor-Integrated Smart Shunts: Madison Scientific SmartShunt
9.4.3.3 Non-Invasive Monitoring Overlays: Rhaeos FlowSense
9.4.3.4 Digital Diagnostics and Adjacent Pipeline Competitors
9.4.4 Consolidation vs. Fragmentation Outlook
9.4.5 Competitive Response Matrix
9.4.6 Strategic Recommendations for 2025–2031
10. Porter's Five Forces Analysis
10.1 Threat of New Entrants
10.2 Bargaining Power of Buyers
10.3 Bargaining Power of Suppliers
10.4 Threat of Substitutes
10.5 Competitive Rivalry
11. PESTLE Analysis
11.1 Political
11.2 Economic
11.3 Sociological
11.4 Technological
11.5 Legal
11.6 Environmental
11.7 PESTLE Summary Table
12. SWOT Analysis
12.1 Industry SWOT Analysis
12.1.1 Detailed Analysis
12.1.1.1 Strengths
12.1.1.2 Weaknesses
12.1.1.3 Opportunities
12.1.1.4 Threats
12.1.2 Strategic Implications
13. Future Trends & Outlook
13.1 Trend Analysis
13.1.1 Endovascular Shunting as a Disruptive Procedural Paradigm
13.1.2 Smart Shunt Systems and Embedded Diagnostic Intelligence
13.1.3 Wearable and Non-Invasive Shunt Monitoring as an Adjacent Revenue Layer
13.1.4 Programmable Valve Technology Refinement and MRI Compatibility
13.1.5 Infection-Resistant Catheter Technologies Extending Product Differentiation
13.1.6 Emerging-Market Epidemiological Expansion and Infrastructure Investment
13.1.7 Regulatory Acceleration and 510(k) Pipeline Activity
13.1.8 Value-Based Care and Health-Economic Evidence Requirements
13.2 Trend Summary Matrix
13.3 Forward Outlook: 2026–2031
List of Exhibits
Exhibit 2.1: Forecast of Global Market YoY Growth Rate & CAGR Summary (in %)
Exhibit 2.2: Forecast of Global Market YoY Growth Rate & CAGR Summary (in %)
Exhibit 2.3: Forecast of Global (in USD Mn)
Exhibit 2.4: Forecast of North America (in USD Mn)
Exhibit 2.5: Forecast of Europe (in USD Mn)
Exhibit 2.6: Forecast of Asia Pacific (in USD Mn)
Exhibit 2.7: Forecast of Latin America (in USD Mn)
Exhibit 2.8: Forecast of Middle East and Africa (in USD Mn)
Exhibit 2.9: Forecast of Global (in Thousand Units)
Exhibit 2.10: Forecast of North America (in Thousand Units)
Exhibit 2.11: Forecast of Europe (in Thousand Units)
Exhibit 2.12: Forecast of Asia Pacific (in Thousand Units)
Exhibit 2.13: Forecast of Latin America (in Thousand Units)
Exhibit 2.14: Forecast of Middle East and Africa (in Thousand Units)
Exhibit 3.15: Forecast of Adjustable (Programmable) Valve Shunt Systems (in USD Mn)
Exhibit 3.16: Forecast of Adjustable (Programmable) Valve Shunt Systems (in Thousand Units)
Exhibit 3.17: Forecast of Fixed-Pressure Valve Shunt Systems (in USD Mn)
Exhibit 3.18: Forecast of Fixed-Pressure Valve Shunt Systems (in Thousand Units)
Exhibit 4.19: Forecast of Pediatric Hydrocephalus (congenital and acquired) (in USD Mn)
Exhibit 4.20: Forecast of Pediatric Hydrocephalus (congenital and acquired) (in Thousand Units)
Exhibit 4.21: Forecast of Segment Application (in USD Mn)
Exhibit 4.22: Forecast of Segment Application (in Thousand Units)
Exhibit 4.23: Forecast of Normal Pressure Hydrocephalus (adult) (in USD Mn)
Exhibit 4.24: Forecast of Normal Pressure Hydrocephalus (adult) (in Thousand Units)
Exhibit 6.25: Forecast of North America (in USD Mn)
Exhibit 6.26: Forecast of United States (in USD Mn)
Exhibit 6.27: Forecast of Canada (in USD Mn)
Exhibit 6.28: Forecast of Mexico (in USD Mn)
Exhibit 6.29: Forecast of Rest of North America (in USD Mn)
Exhibit 6.30: Forecast of North America (in Thousand Units)
Exhibit 6.31: Forecast of United States (in Thousand Units)
Exhibit 6.32: Forecast of Canada (in Thousand Units)
Exhibit 6.33: Forecast of Mexico (in Thousand Units)
Exhibit 6.34: Forecast of Rest of North America (in Thousand Units)
Exhibit 6.35: Forecast of Europe (in USD Mn)
Exhibit 6.36: Forecast of Germany (in USD Mn)
Exhibit 6.37: Forecast of United Kingdom (in USD Mn)
Exhibit 6.38: Forecast of France (in USD Mn)
Exhibit 6.39: Forecast of Italy (in USD Mn)
Exhibit 6.40: Forecast of Spain (in USD Mn)
Exhibit 6.41: Forecast of Russia (in USD Mn)
Exhibit 6.42: Forecast of Rest of Europe (in USD Mn)
Exhibit 6.43: Forecast of Europe (in Thousand Units)
Exhibit 6.44: Forecast of Germany (in Thousand Units)
Exhibit 6.45: Forecast of United Kingdom (in Thousand Units)
Exhibit 6.46: Forecast of France (in Thousand Units)
Exhibit 6.47: Forecast of Italy (in Thousand Units)
Exhibit 6.48: Forecast of Spain (in Thousand Units)
Exhibit 6.49: Forecast of Russia (in Thousand Units)
Exhibit 6.50: Forecast of Rest of Europe (in Thousand Units)
Exhibit 6.51: Forecast of Asia Pacific (in USD Mn)
Exhibit 6.52: Forecast of Japan (in USD Mn)
Exhibit 6.53: Forecast of China (in USD Mn)
Exhibit 6.54: Forecast of South Korea (in USD Mn)
Exhibit 6.55: Forecast of India (in USD Mn)
Exhibit 6.56: Forecast of Australia (in USD Mn)
Exhibit 6.57: Forecast of Rest of Asia Pacific (in USD Mn)
Exhibit 6.58: Forecast of Asia Pacific (in Thousand Units)
Exhibit 6.59: Forecast of Japan (in Thousand Units)
Exhibit 6.60: Forecast of China (in Thousand Units)
Exhibit 6.61: Forecast of South Korea (in Thousand Units)
Exhibit 6.62: Forecast of India (in Thousand Units)
Exhibit 6.63: Forecast of Australia (in Thousand Units)
Exhibit 6.64: Forecast of Rest of Asia Pacific (in Thousand Units)
Exhibit 6.65: Forecast of Latin America (in USD Mn)
Exhibit 6.66: Forecast of Brazil (in USD Mn)
Exhibit 6.67: Forecast of Argentina (in USD Mn)
Exhibit 6.68: Forecast of Colombia (in USD Mn)
Exhibit 6.69: Forecast of Chile (in USD Mn)
Exhibit 6.70: Forecast of Rest of Latin America (in USD Mn)
Exhibit 6.71: Forecast of Latin America (in Thousand Units)
Exhibit 6.72: Forecast of Brazil (in Thousand Units)
Exhibit 6.73: Forecast of Argentina (in Thousand Units)
Exhibit 6.74: Forecast of Colombia (in Thousand Units)
Exhibit 6.75: Forecast of Chile (in Thousand Units)
Exhibit 6.76: Forecast of Rest of Latin America (in Thousand Units)
Exhibit 6.77: Forecast of Middle East and Africa (in USD Mn)
Exhibit 6.78: Forecast of GCC Countries (in USD Mn)
Exhibit 6.79: Forecast of Turkey (in USD Mn)
Exhibit 6.80: Forecast of Israel (in USD Mn)
Exhibit 6.81: Forecast of South Africa (in USD Mn)
Exhibit 6.82: Forecast of Egypt (in USD Mn)
Exhibit 6.83: Forecast of Rest of Middle East and Africa (in USD Mn)
Exhibit 6.84: Forecast of Middle East and Africa (in Thousand Units)
Exhibit 6.85: Forecast of GCC Countries (in Thousand Units)
Exhibit 6.86: Forecast of Turkey (in Thousand Units)
Exhibit 6.87: Forecast of Israel (in Thousand Units)
Exhibit 6.88: Forecast of South Africa (in Thousand Units)
Exhibit 6.89: Forecast of Egypt (in Thousand Units)
Exhibit 6.90: Forecast of Rest of Middle East and Africa (in Thousand Units)
*If Applicable.

NAVADHI is a market research company that helps global firms differentiate themselves, break market entry barriers, track their investments, develop business strategies and plan for future by providing actionable market research intelligence that helps them succeed.