
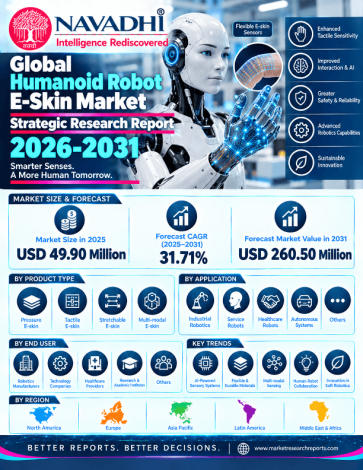

The global humanoid robot e-skin market is estimated at US$49.9 million in 2025 and is forecast to reach US$260.5 million by 2031, a compound annual growth rate (CAGR) of 31.7% over 2025-2031. Volume is estimated at about 1.7 million modules in 2025, rising to about 15.3 million in 2031. The 2025 base blends a bottom-up channel build (US$37 million) with a 10% weight on the median of published estimates (US$167.5 million). No audited industry sales series exists and published sizes conflict, so confidence in the absolute base is low; the direction of growth is better supported. Bear and bull cases for 2031 are US$196.3 million (25.6% CAGR) and US$344.0 million (38.0% CAGR).
Humanoid robot e-skin is the flexible electronic skin and tactile sensing layer that gives humanoid robots a sense of touch: tactile modules on fingertips and fingers, array sensors on palms and hand surfaces, and large-area skin patches on the torso, arms, legs and feet, sold together with their readout electronics. Value is manufacturer-level revenue in US dollars; volume is tactile sensing modules.
Scope of the Global Humanoid Robot E-Skin Market Strategic Research Report
This report covers market value (US$ million) and module volume (million modules) for 2022-2031, with 2025 as the base year and 2026-2031 as the forecast period. It analyses five sensing technologies, four deployment segments, five regions and 24 named countries (plus rest-of-region groupings), and profiles 10 companies. Complete robots, dexterous hands sold as hands, joint torque and six-axis force sensors, cameras, software and datasets are excluded.
Segment by Type
Segment by Application
Segment by Region
Who Can Use This Report?
1. Executive Summary
1.1.1 Market Definition and Sizing
1.1.2 Principal Growth Drivers
1.1.3 Segmentation Highlights
1.1.4 Competitive Structure
1.1.5 Principal Risks and Restraints
1.1.6 Closing Outlook
2. Industry Overview & Forecast
2.1 Market Definition and Scope
2.2 Market Size and Historical Performance
2.3 Forecast and Growth Logic
2.4 Volume Analysis
2.5 Value Chain and Pricing Dynamics
3. Market Segmentation by Type
3.1 Overview of the Type Segmentation Framework
3.2 Volume Analysis
3.2.1 Global Module Volume: Year-by-Year Trend
3.3 Piezoresistive Sensors
3.3.1 Definition and Applications
3.3.2 Market Size and Share
3.3.3 Growth Outlook
3.3.4 Demand Drivers, Technology, and Key Suppliers
3.4 Capacitive Sensors
3.4.1 Definition and Applications
3.4.2 Market Size and Share
3.4.3 Growth Outlook
3.4.4 Demand Drivers, Technology, and Key Suppliers
3.5 Optical and Vision-Based Sensors
3.5.1 Definition and Applications
3.5.2 Market Size and Share
3.5.3 Growth Outlook
3.5.4 Demand Drivers, Technology, and Key Suppliers
3.6 Magnetic and Hall-Effect Sensors
3.6.1 Definition and Applications
3.6.2 Market Size and Share
3.6.3 Growth Outlook
3.6.4 Demand Drivers, Technology, and Key Suppliers
3.7 Textile, Piezoelectric and Other Sensors
3.7.1 Definition and Applications
3.7.2 Market Size and Share
3.7.3 Growth Outlook
3.7.4 Demand Drivers, Technology, and Key Suppliers
3.8 Comparative Mix Shift and Technology Transition Dynamics
4. Market Segmentation by Application
4.1 Overview of the Application Segmentation Framework
4.1.1 Research, Education and Data Collection
4.1.2 Industrial and Manufacturing
4.1.3 Logistics and Warehousing
4.1.4 Service, Healthcare and Entertainment
4.2 Comparative Dynamics Across Application Segments
5. Regional Market Forecast
5.1 North America
5.1.1 Regional Overview
5.1.2 Key Growth Drivers
5.1.3 Regulatory & Infrastructure Landscape
5.1.4 Country-Level Analysis
5.1.5 Market Forecast 2025–2031
5.2 Europe
5.2.1 Regional Overview
5.2.2 Key Growth Drivers
5.2.3 Regulatory & Infrastructure Landscape
5.2.4 Country-Level Analysis
5.2.5 Market Forecast 2025–2031
5.3 Asia Pacific
5.3.1 Regional Overview
5.3.2 Key Growth Drivers
5.3.3 Regulatory & Infrastructure Landscape
5.3.4 Country-Level Analysis
5.3.5 Market Forecast 2025–2031
5.4 Latin America
5.4.1 Regional Overview
5.4.2 Key Growth Drivers
5.4.3 Regulatory & Infrastructure Landscape
5.4.4 Country-Level Analysis
5.4.5 Market Forecast 2025–2031
5.5 Middle East and Africa
5.5.1 Regional Overview
5.5.2 Key Growth Drivers
5.5.3 Regulatory & Infrastructure Landscape
5.5.4 Country-Level Analysis
5.5.5 Market Forecast 2025–2031
6. Country-Level Market Forecast
6.1 North America
6.1.1 United States
6.1.2 Canada
6.1.3 Mexico
6.1.4 Rest of North America
6.2 Europe
6.2.1 Germany
6.2.2 United Kingdom
6.2.3 France
6.2.4 Switzerland
6.2.5 Netherlands
6.2.6 Italy
6.2.7 Rest of Europe
6.3 Asia Pacific
6.3.1 China
6.3.2 Japan
6.3.3 South Korea
6.3.4 Singapore
6.3.5 India
6.3.6 Australia
6.3.7 Rest of Asia Pacific
6.4 Latin America
6.4.1 Brazil
6.4.2 Chile
6.4.3 Colombia
6.4.4 Argentina
6.4.5 Rest of Latin America
6.5 Middle East and Africa
6.5.1 United Arab Emirates
6.5.2 Saudi Arabia
6.5.3 Israel
6.5.4 South Africa
6.5.5 Turkey
6.5.6 Rest of Middle East and Africa
7. Growth Drivers & Inhibitors
7.1 Overview
7.2 Market Growth Drivers
7.2.1 Surging Venture Capital and Strategic Investment into Tactile Sensing Ecosystems
7.2.2 Accelerating Humanoid Robot Deployment and Unit Volume Growth
7.2.3 China's National Industrial Policy and Domestic Technology Leadership
7.2.4 Growing Demand for Dexterous Manipulation and Embodied AI Training Data
7.2.5 Technology Diversification and Cost Reduction Across Sensing Modalities
7.2.6 Emerging Healthcare, Service, and Cross-Sector Commercial Applications
7.3 Market Inhibitors
7.3.1 Predominance of Non-Tactile Deployment Use Cases in the Current Installed Base
7.3.2 Rapid Price Erosion and Chinese Competitive Cost Pressure
7.3.3 Technology Fragmentation and Absence of Interoperability Standards
7.3.4 Durability, Calibration, and Large-Area Deployment Challenges
7.3.5 Vertical Integration by Large Humanoid OEMs
7.4 Driver and Inhibitor Impact Assessment
7.5 Integrated Assessment
8. Key Company Profiles
8.1 PaXini Tech
8.1.1 Company Overview
8.1.2 Key Products & Segments
8.1.3 Financial Performance (2023–2025)
8.1.4 Business Strategy
8.1.5 SWOT Analysis
8.1.6 Strategic Implications (2025–2031)
8.2 Tashan Technology
8.2.1 Company Overview
8.2.2 Key Products & Segments
8.2.3 Financial Performance (2023–2025)
8.2.4 Business Strategy
8.2.5 SWOT Analysis
8.2.6 Strategic Implications (2025–2031)
8.3 XELA Robotics
8.3.1 Company Overview
8.3.2 Key Products & Segments
8.3.3 Financial Performance (2023–2025)
8.3.4 Business Strategy
8.3.5 SWOT Analysis
8.3.6 Strategic Implications (2025–2031)
8.4 GelSight
8.4.1 Company Overview
8.4.2 Key Products & Segments
8.4.3 Financial Performance (2023–2025)
8.4.4 Business Strategy
8.4.5 SWOT Analysis
8.4.6 Strategic Implications (2025–2031)
8.5 Touchlab
8.5.1 Company Overview
8.5.2 Key Products & Segments
8.5.3 Financial Performance (2023–2025)
8.5.4 Business Strategy
8.5.5 SWOT Analysis
8.5.6 Strategic Implications (2025–2031)
8.6 Contactile
8.6.1 Company Overview
8.6.2 Key Products & Segments
8.6.3 Financial Performance (2023–2025)
8.6.4 Business Strategy
8.6.5 SWOT Analysis
8.6.6 Strategic Implications (2025–2031)
8.7 Daimon Robotics
8.7.1 Company Overview
8.7.2 Key Products & Segments
8.7.3 Financial Performance (2023–2025)
8.7.4 Business Strategy
8.7.5 SWOT Analysis
8.7.6 Strategic Implications (2025–2031)
8.8 BeBop Sensors
8.8.1 Company Overview
8.8.2 Key Products & Segments
8.8.3 Financial Performance (2023–2025)
8.8.4 Business Strategy
8.8.5 SWOT Analysis
8.8.6 Strategic Implications (2025–2031)
8.9 Tekscan
8.9.1 Company Overview
8.9.2 Key Products & Segments
8.9.3 Financial Performance (2023–2025)
8.9.4 Business Strategy
8.9.5 SWOT Analysis
8.9.6 Strategic Implications (2025–2031)
8.10 Interlink Electronics
8.10.1 Company Overview
8.10.2 Key Products & Segments
8.10.3 Financial Performance (2023–2025)
8.10.4 Business Strategy
8.10.5 SWOT Analysis
8.10.6 Strategic Implications (2025–2031)
9. Competitive Landscape
9.1 Competitive Landscape Overview
9.1.1 Market Structure and the Nature of Competition
9.1.2 Why Concentration Cannot Be Measured
9.1.3 Company Fact Table
9.1.4 Competitive Intensity Assessment
9.2 Competitive Intensity Assessment
9.2.1 Market Structure and Strategic Groupings
9.2.2 Capacity Versus Demand Dynamics
9.2.3 Pricing Environment and Price Trajectory
9.2.4 Barriers to Entry and Exit
9.3 Key Player Strategies & Positioning
9.3.1 Strategic Group Narrative
9.3.2 M&A and Partnership Activity (2022–Present)
9.3.3 Geographic Strongholds
9.3.4 R&D and Technology Investment Trends
9.4 Competitive Dynamics & Strategic Outlook
9.4.1 Market Structure
9.4.2 Emerging Competitive Threats
9.4.3 Consolidation vs. Fragmentation Outlook
9.4.4 Competitive Response Matrix
9.4.5 Strategic Recommendations for Market Participants, 2025–2031
10. Porter's Five Forces Analysis
10.1 Threat of New Entrants
10.2 Bargaining Power of Buyers
10.3 Bargaining Power of Suppliers
10.4 Threat of Substitutes
10.5 Competitive Rivalry
11. PESTLE Analysis
11.1 Overview and Analytical Framework
11.2 Political
11.3 Economic
11.4 Social
11.5 Technological
11.6 Legal
11.7 Environmental
11.8 PESTLE Summary Table
12. SWOT Analysis
12.1.1 Detailed Analysis
12.2 Strengths
12.3 Weaknesses
12.4 Opportunities
12.5 Threats
12.6 Strategic Implications
13. Future Trends & Outlook
13.1 Trend: Humanoid Robot Volume Ramp Driving Step-Change in E-Skin Demand
13.2 Trend: Structural Price Deflation Accelerating Market Penetration
13.3 Trend: AI-Integrated Tactile Intelligence Redefining Product Value
13.4 Trend: Chinese Domestic Ecosystem Consolidation and Capital Intensity
13.5 Trend: Multimodal Vision-Tactile Sensing Gaining Structural Advantage
13.6 Trend: Textile and Conformal Skin Surfaces Transitioning from Research to Pre-Commercial
13.7 Trend: Application Diversification Beyond Research Into Industrial and Service Verticals
13.8 Trend: In-House Tactile Development by Humanoid OEMs Creating Platform Risk
13.9 Summary of Key Trends
13.10 Forward Outlook: 2026–2031
*If Applicable.

NAVADHI is a market research company that helps global firms differentiate themselves, break market entry barriers, track their investments, develop business strategies and plan for future by providing actionable market research intelligence that helps them succeed.