
NAVADHI Market Research
Published on NAVADHI Market Research (https://www.navadhi.com)

Home > Global Food & Beverage Industry Strategic Research Report 2026-2031

Global Food & Beverage Industry Strategic Research Report 2026-2031

Global Food & Beverage Industry Strategic Research Report 2026-2031
Publication ID: 
NAV1026041
Publication Date: 
October 30, 2026
Pages: 
323
Countries: 
Global [1]
Please choose the suitable license type from above. More details are at given under tab "Report License Types" below.

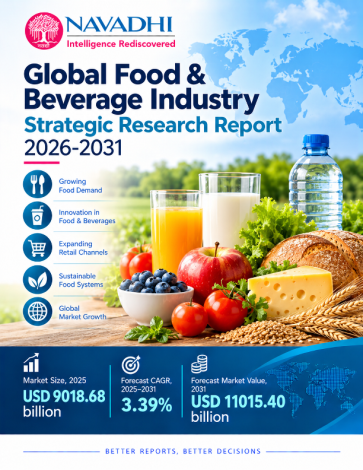
The global food and beverage industry is estimated at US$9,018.68 billion (about US$9.0 trillion) in 2025 and is forecast to reach US$11,015.40 billion by 2031, a compound annual growth rate (CAGR) of 3.4% over 2025-2031. Foodservice is the largest of six mutually exclusive product types at US$3,190,000.0 million (35.4% share) in 2025, followed by alcoholic beverages at 18.3% and packaged and processed foods at 15.8%. Dairy products (4.4% CAGR) and packaged and processed foods (4.3% CAGR) are the fastest-growing types, and alcoholic beverages (2.2% CAGR) the slowest. Asia Pacific is the largest region at US$3,310,396.0 million (36.7% share) in 2025.

The report sizes consumer-facing sales of processed and packaged food, dairy products, confectionery and snacks, non-alcoholic beverages, alcoholic beverages and foodservice. Farm output and unprocessed fresh food, food ingredients, pet food, tobacco and retail grocery margin are outside scope. Physical volume is carried only for dairy (about 1,000.6 million tonnes of raw milk equivalent in 2025); the other five types are valued on revenue alone, and the report says so instead of inventing tonnage. Where a figure could not be verified from a public source, the report says so and does not present it as fact.

Scope of the Global Food & Beverage Industry Strategic Research Report

This report covers market value (US$ million) for 2022-2031, with 2025 as the base year and 2026-2031 as the forecast period, and dairy volume (million tonnes). It analyses six product types, six sales channels, five regions and country-level markets (27 named countries or groupings plus five rest-of-region groups), and profiles 25 companies across food manufacturing, beverages, dairy and foodservice.

Segment by Type

  • Packaged & Processed Foods
  • Dairy Products
  • Confectionery & Snacks
  • Non-Alcoholic Beverages
  • Alcoholic Beverages
  • Foodservice

Segment by Application (Sales Channel)

  • Supermarkets & Hypermarkets
  • Convenience & Specialty Stores
  • E-commerce & Online Grocery
  • Foodservice & On-Trade
  • Institutional & B2B Supply
  • Other Channels

Segment by Region

  • North America (United States, Canada, Mexico, Rest of North America)
  • Europe (Germany, France, United Kingdom, Italy, Spain, Russia, Netherlands, Rest of Europe)
  • Asia Pacific (China, India, Japan, Indonesia, South Korea, Australia, Southeast Asia excluding Indonesia, Rest of Asia Pacific)
  • Latin America (Brazil, Argentina, Colombia, Chile, Rest of Latin America)
  • Middle East and Africa (Turkey, Saudi Arabia, South Africa, Egypt, United Arab Emirates, Nigeria, Rest of Middle East and Africa)

Companies Profiled

Nestlé S.A., Unilever PLC, Danone S.A., The Kraft Heinz Company, General Mills, Inc., Mondelez International, Inc., The Hershey Company, JBS S.A., Tyson Foods, Inc., The Coca-Cola Company, PepsiCo, Inc., Keurig Dr Pepper Inc., Anheuser-Busch InBev SA/NV, Heineken N.V., Diageo plc, Pernod Ricard SA, Carlsberg A/S, Groupe Lactalis, Fonterra Co-operative Group, Arla Foods amba, McDonald's Corporation, Yum! Brands, Inc., Starbucks Corporation, Restaurant Brands International Inc., Compass Group PLC.

Who Can Use This Report?

  • Food, beverage and dairy manufacturers benchmarking category growth, pricing and competitor positioning
  • Retailers, foodservice operators and distributors planning channel strategy across supermarkets, convenience, e-commerce and on-trade
  • Investors and corporate strategy teams assessing growth, portfolio moves and regional exposure across the food and beverage value chain
  • Policy makers and trade bodies tracking consumption, regulation and regional demand

1. Executive Summary
    1.1 Market Definition and Scale
    1.2 Key Growth Drivers
    1.3 Segmentation Highlights
    1.3.1 By Product Type
    1.3.2 By Sales Channel
    1.4 Regional and Country Highlights
    1.5 Competitive Structure
    1.6 Principal Risks
    1.7 Strategic Outlook
2. Industry Overview & Forecast
    2.1.1 Market Definition and Scope
    2.1.2 Market Size and Historical Performance
    2.1.3 Forecast and Growth Logic
    2.1.4 Volume Analysis
    2.1.5 Value-Chain and Pricing Dimensions
    2.1.6 Confidence and Data Quality
3. Market Segmentation by Type
    3.1 Overview of the Type Segmentation Framework
    3.2 Volume Analysis
    3.2.1 Global Dairy Volume: Year-by-Year Summary
    3.2.2 Packaged & Processed Foods
    3.2.3 Dairy Products
    3.2.4 Confectionery & Snacks
    3.2.5 Non-Alcoholic Beverages
    3.2.6 Alcoholic Beverages
    3.2.7 Foodservice
    3.3 Comparative Mix-Shift Analysis
4. Market Segmentation by Application
    4.1 Overview and Structural Logic
    4.1.1 Supermarkets and Hypermarkets
    4.1.2 Convenience and Specialty Stores
    4.1.3 E-commerce and Online Grocery
    4.1.4 Foodservice and On-Trade
    4.1.5 Institutional and B2B Supply
    4.1.6 Other Channels
    4.1.7 Comparative Channel Assessment
5. Regional Market Forecast
    5.1 North America
    5.1.1 Regional Overview
    5.1.2 Key Growth Drivers
    5.1.3 Regulatory & Infrastructure Landscape
    5.1.4 Country-Level Analysis
    5.1.5 Market Forecast 2025–2031
    5.2 Europe
    5.2.1 Regional Overview
    5.2.2 Key Growth Drivers
    5.2.3 Regulatory & Infrastructure Landscape
    5.2.4 Country-Level Analysis
    5.2.5 Market Forecast 2025–2031
    5.3 Asia Pacific
    5.3.1 Regional Overview
    5.3.2 Key Growth Drivers
    5.3.3 Regulatory & Infrastructure Landscape
    5.3.4 Country-Level Analysis
    5.3.5 Market Forecast 2025–2031
    5.4 Latin America
    5.4.1 Regional Overview
    5.4.2 Key Growth Drivers
    5.4.3 Regulatory & Infrastructure Landscape
    5.4.4 Country-Level Analysis
    5.4.5 Market Forecast 2025–2031
    5.5 Middle East and Africa
    5.5.1 Regional Overview
    5.5.2 Key Growth Drivers
    5.5.3 Regulatory & Infrastructure Landscape
    5.5.4 Country-Level Analysis
    5.5.5 Market Forecast 2025–2031
6. Country-Level Market Forecast
    6.1 North America
    6.1.1 United States
    6.1.2 Canada
    6.1.3 Mexico
    6.1.4 Rest of North America
    6.2 Europe
    6.2.1 Germany
    6.2.2 France
    6.2.3 United Kingdom
    6.2.4 Italy
    6.2.5 Spain
    6.2.6 Russia
    6.2.7 Netherlands
    6.2.8 Rest of Europe
    6.3 Asia Pacific
    6.3.1 China
    6.3.2 India
    6.3.3 Japan
    6.3.4 Indonesia
    6.3.5 South Korea
    6.3.6 Australia
    6.3.7 Southeast Asia excluding Indonesia
    6.3.8 Rest of Asia Pacific
    6.4 Latin America
    6.4.1 Brazil
    6.4.2 Argentina
    6.4.3 Colombia
    6.4.4 Chile
    6.4.5 Rest of Latin America
    6.5 Middle East and Africa
    6.5.1 Turkey
    6.5.2 Saudi Arabia
    6.5.3 South Africa
    6.5.4 Egypt
    6.5.5 United Arab Emirates
    6.5.6 Nigeria
    6.5.7 Rest of Middle East and Africa
7. Growth Drivers & Inhibitors
    7.1 Section Overview
    7.2 Growth Drivers
    7.3 Growth Restraints
    7.4 Driver and Restraint Impact Assessment
    7.5 Integrated Assessment
8. Key Company Profiles
    8.1 Nestlé S.A.
    8.1.1 Company Overview
    8.1.2 Key Products & Segments
    8.1.3 Financial Performance (2023–2025)
    8.1.4 Business Strategy
    8.1.5 SWOT Analysis
    8.1.6 Strategic Implications (2025–2031)
    8.2 Unilever PLC
    8.2.1 Company Overview
    8.2.2 Key Products & Segments
    8.2.3 Financial Performance (2023–2025)
    8.2.4 Business Strategy
    8.2.5 SWOT Analysis
    8.2.6 Strategic Implications (2025–2031)
    8.3 Danone S.A.
    8.3.1 Company Overview
    8.3.2 Key Products & Segments
    8.3.3 Financial Performance (2023–2025)
    8.3.4 Business Strategy
    8.3.5 SWOT Analysis
    8.3.6 Strategic Implications (2025–2031)
    8.4 The Kraft Heinz Company
    8.4.1 Company Overview
    8.4.2 Key Products & Segments
    8.4.3 Financial Performance (2023–2025)
    8.4.4 Business Strategy
    8.4.5 SWOT Analysis
    8.4.6 Strategic Implications (2025–2031)
    8.5 General Mills, Inc.
    8.5.1 Company Overview
    8.5.2 Key Products & Segments
    8.5.3 Financial Performance (2023–2025)
    8.5.4 Business Strategy
    8.5.5 SWOT Analysis
    8.5.6 Strategic Implications (2025–2031)
    8.6 Mondelez International, Inc.
    8.6.1 Company Overview
    8.6.2 Key Products & Segments
    8.6.3 Financial Performance (2023–2025)
    8.6.4 Business Strategy
    8.6.5 SWOT Analysis
    8.6.6 Strategic Implications (2025–2031)
    8.7 The Hershey Company
    8.7.1 Company Overview
    8.7.2 Key Products & Segments
    8.7.3 Financial Performance (2023–2025)
    8.7.4 Business Strategy
    8.7.5 SWOT Analysis
    8.7.6 Strategic Implications (2025–2031)
    8.8 JBS S.A.
    8.8.1 Company Overview
    8.8.2 Key Products & Segments
    8.8.3 Financial Performance (2023–2025)
    8.8.4 Business Strategy
    8.8.5 SWOT Analysis
    8.8.6 Strategic Implications (2025–2031)
    8.9 Tyson Foods, Inc.
    8.9.1 Company Overview
    8.9.2 Key Products & Segments
    8.9.3 Financial Performance (2023–2025)
    8.9.4 Business Strategy
    8.9.5 SWOT Analysis
    8.9.6 Strategic Implications (2025–2031)
    8.10 The Coca-Cola Company
    8.10.1 Company Overview
    8.10.2 Key Products & Segments
    8.10.3 Financial Performance (2023–2025)
    8.10.4 Business Strategy
    8.10.5 SWOT Analysis
    8.10.6 Strategic Implications (2025–2031)
    8.11 PepsiCo, Inc.
    8.11.1 Company Overview
    8.11.2 Key Products & Segments
    8.11.3 Financial Performance (2023–2025)
    8.11.4 Business Strategy
    8.11.5 SWOT Analysis
    8.11.6 Strategic Implications (2025–2031)
    8.12 Keurig Dr Pepper Inc.
    8.12.1 Company Overview
    8.12.2 Key Products & Segments
    8.12.3 Financial Performance (2023–2025)
    8.12.4 Business Strategy
    8.12.5 SWOT Analysis
    8.12.6 Strategic Implications (2025–2031)
    8.13 Anheuser-Busch InBev SA/NV
    8.13.1 Company Overview
    8.13.2 Key Products & Segments
    8.13.3 Financial Performance (2023–2025)
    8.13.4 Business Strategy
    8.13.5 SWOT Analysis
    8.13.6 Strategic Implications (2025–2031)
    8.14 Heineken N.V.
    8.14.1 Company Overview
    8.14.2 Key Products & Segments
    8.14.3 Financial Performance (2023–2025)
    8.14.4 Business Strategy
    8.14.5 SWOT Analysis
    8.14.6 Strategic Implications (2025–2031)
    8.15 Diageo plc
    8.15.1 Company Overview
    8.15.2 Key Products & Segments
    8.15.3 Financial Performance (2023–2025)
    8.15.4 Business Strategy
    8.15.5 SWOT Analysis
    8.15.6 Strategic Implications (2025–2031)
    8.16 Pernod Ricard SA
    8.16.1 Company Overview
    8.16.2 Key Products & Segments
    8.16.3 Financial Performance (2023–2025)
    8.16.4 Business Strategy
    8.16.5 SWOT Analysis
    8.16.6 Strategic Implications (2025–2031)
    8.17 Carlsberg A/S
    8.17.1 Company Overview
    8.17.2 Key Products & Segments
    8.17.3 Financial Performance (2023–2025)
    8.17.4 Business Strategy
    8.17.5 SWOT Analysis
    8.17.6 Strategic Implications (2025–2031)
    8.18 Groupe Lactalis
    8.18.1 Company Overview
    8.18.2 Key Products & Segments
    8.18.3 Financial Performance (2023–2025)
    8.18.4 Business Strategy
    8.18.5 SWOT Analysis
    8.18.6 Strategic Implications (2025–2031)
    8.19 Fonterra Co-operative Group
    8.19.1 Company Overview
    8.19.2 Key Products & Segments
    8.19.3 Financial Performance (2023–2025)
    8.19.4 Business Strategy
    8.19.5 SWOT Analysis
    8.19.6 Strategic Implications (2025–2031)
    8.20 Arla Foods amba
    8.20.1 Company Overview
    8.20.2 Key Products & Segments
    8.20.3 Financial Performance (2023–2025)
    8.20.4 Business Strategy
    8.20.5 SWOT Analysis
    8.20.6 Strategic Implications (2025–2031)
    8.21 McDonald's Corporation
    8.21.1 Company Overview
    8.21.2 Key Products & Segments
    8.21.3 Financial Performance (2023–2025)
    8.21.4 Business Strategy
    8.21.5 SWOT Analysis
    8.21.6 Strategic Implications (2025–2031)
    8.22 Yum! Brands, Inc.
    8.22.1 Company Overview
    8.22.2 Key Products & Segments
    8.22.3 Financial Performance (2023–2025)
    8.22.4 Business Strategy
    8.22.5 SWOT Analysis
    8.22.6 Strategic Implications (2025–2031)
    8.23 Starbucks Corporation
    8.23.1 Company Overview
    8.23.2 Key Products & Segments
    8.23.3 Financial Performance (2023–2025)
    8.23.4 Business Strategy
    8.23.5 SWOT Analysis
    8.23.6 Strategic Implications (2025–2031)
    8.24 Restaurant Brands International Inc.
    8.24.1 Company Overview
    8.24.2 Key Products & Segments
    8.24.3 Financial Performance (2023–2025)
    8.24.4 Business Strategy
    8.24.5 SWOT Analysis
    8.24.6 Strategic Implications (2025–2031)
    8.25 Compass Group PLC
    8.25.1 Company Overview
    8.25.2 Key Products & Segments
    8.25.3 Financial Performance (2023–2025)
    8.25.4 Business Strategy
    8.25.5 SWOT Analysis
    8.25.6 Strategic Implications (2025–2031)
9. Competitive Landscape
    9.1 Competitive Landscape Overview
    9.1.1 Market Structure and the Nature of Competition
    9.1.2 Verified Company Reference Table
    9.1.3 Why Concentration Cannot Be Measured
    9.1.4 Growth Momentum and Competitive Divergence
    9.1.5 Overall Competitive Intensity Assessment
    9.2 Competitive Intensity Assessment
    9.2.1 Structure of Competition Across the Global Food & Beverage Landscape
    9.2.2 Competitive Groupings by Strategic Posture
    9.2.3 Capacity Versus Demand Dynamics
    9.2.4 Pricing Environment: Premium, Value, and Commoditised Layers
    9.2.5 Barriers to Entry and Exit
    9.2.6 Competitive Intensity Outlook: 2026–2031
    9.3 Key Player Strategies & Positioning
    9.3.1 Strategic Group Map Narrative
    9.3.2 Selected 2025 Financial Benchmarks for Key Players
    9.3.3 Differentiation Strategies Across Major Players
    9.3.4 Geographic Strongholds

10. Porter's Five Forces Analysis10.1 Threat of New Entrants
10.2 Bargaining Power of Buyers
10.3 Bargaining Power of Suppliers
10.4 Threat of Substitutes
10.5 Competitive Rivalry
11. PESTLE Analysis11.1 Political
11.2 Economic
11.3 Sociocultural
11.4 Technological
11.5 Legal
11.6 Environmental
11.7 PESTLE Summary Assessment
12. SWOT Analysis12.1 Industry SWOT Analysis
12.1.1 Detailed Analysis
12.1.1.1 Strengths
12.1.1.2 Weaknesses
12.1.1.3 Opportunities
12.1.1.4 Threats
12.1.2 Strategic Implications
13. Future Trends & Outlook


List of Exhibits
Exhibit 2.1: Forecast of Global Market YoY Growth Rate & CAGR Summary (in %)
Exhibit 2.2: Forecast of Global Market YoY Growth Rate & CAGR Summary (in %)
Exhibit 2.3: Forecast of Global (in USD Bn)
Exhibit 2.4: Forecast of North America (in USD Bn)
Exhibit 2.5: Forecast of Europe (in USD Bn)
Exhibit 2.6: Forecast of Asia Pacific (in USD Bn)
Exhibit 2.7: Forecast of Latin America (in USD Bn)
Exhibit 2.8: Forecast of Middle East and Africa (in USD Bn)
Exhibit 2.9: Forecast of Global (in Mt)
Exhibit 2.10: Forecast of North America (in Mt)
Exhibit 2.11: Forecast of Europe (in Mt)
Exhibit 2.12: Forecast of Asia Pacific (in Mt)
Exhibit 2.13: Forecast of Latin America (in Mt)
Exhibit 2.14: Forecast of Middle East and Africa (in Mt)
Exhibit 3.15: Forecast of Packaged & Processed Foods (in USD Bn)
Exhibit 3.16: Forecast of Foodservice (in USD Bn)
Exhibit 3.17: Forecast of Dairy Products (in USD Bn)
Exhibit 3.18: Forecast of Dairy Products (in Mt)
Exhibit 3.19: Forecast of Confectionery & Snacks (in USD Bn)
Exhibit 3.20: Forecast of Non-Alcoholic Beverages (in USD Bn)
Exhibit 3.21: Forecast of Alcoholic Beverages (in USD Bn)
Exhibit 4.22: Forecast of Supermarkets & Hypermarkets (in USD Bn)
Exhibit 4.23: Forecast of Supermarkets & Hypermarkets (in Mt)
Exhibit 4.24: Forecast of Convenience & Specialty Stores (in USD Bn)
Exhibit 4.25: Forecast of Convenience & Specialty Stores (in Mt)
Exhibit 4.26: Forecast of E-commerce & Online Grocery (in USD Bn)
Exhibit 4.27: Forecast of E-commerce & Online Grocery (in Mt)
Exhibit 4.28: Forecast of Foodservice & On-Trade (in USD Bn)
Exhibit 4.29: Forecast of Foodservice & On-Trade (in Mt)
Exhibit 4.30: Forecast of Institutional & B2B Supply (in USD Bn)
Exhibit 4.31: Forecast of Institutional & B2B Supply (in Mt)
Exhibit 4.32: Forecast of Other Channels (in USD Bn)
Exhibit 4.33: Forecast of Other Channels (in Mt)
Exhibit 6.34: Forecast of North America (in USD Bn)
Exhibit 6.35: Forecast of United States (in USD Bn)
Exhibit 6.36: Forecast of Canada (in USD Bn)
Exhibit 6.37: Forecast of Mexico (in USD Bn)
Exhibit 6.38: Forecast of Rest of North America (in USD Bn)
Exhibit 6.39: Forecast of North America (in Mt)
Exhibit 6.40: Forecast of United States (in Mt)
Exhibit 6.41: Forecast of Canada (in Mt)
Exhibit 6.42: Forecast of Mexico (in Mt)
Exhibit 6.43: Forecast of Rest of North America (in Mt)
Exhibit 6.44: Forecast of Europe (in USD Bn)
Exhibit 6.45: Forecast of Germany (in USD Bn)
Exhibit 6.46: Forecast of France (in USD Bn)
Exhibit 6.47: Forecast of United Kingdom (in USD Bn)
Exhibit 6.48: Forecast of Italy (in USD Bn)
Exhibit 6.49: Forecast of Spain (in USD Bn)
Exhibit 6.50: Forecast of Russia (in USD Bn)
Exhibit 6.51: Forecast of Netherlands (in USD Bn)
Exhibit 6.52: Forecast of Rest of Europe (in USD Bn)
Exhibit 6.53: Forecast of Europe (in Mt)
Exhibit 6.54: Forecast of Germany (in Mt)
Exhibit 6.55: Forecast of France (in Mt)
Exhibit 6.56: Forecast of United Kingdom (in Mt)
Exhibit 6.57: Forecast of Italy (in Mt)
Exhibit 6.58: Forecast of Spain (in Mt)
Exhibit 6.59: Forecast of Russia (in Mt)
Exhibit 6.60: Forecast of Netherlands (in Mt)
Exhibit 6.61: Forecast of Rest of Europe (in Mt)
Exhibit 6.62: Forecast of Asia Pacific (in USD Bn)
Exhibit 6.63: Forecast of China (in USD Bn)
Exhibit 6.64: Forecast of India (in USD Bn)
Exhibit 6.65: Forecast of Japan (in USD Bn)
Exhibit 6.66: Forecast of Indonesia (in USD Bn)
Exhibit 6.67: Forecast of South Korea (in USD Bn)
Exhibit 6.68: Forecast of Australia (in USD Bn)
Exhibit 6.69: Forecast of Southeast Asia excluding Indonesia (in USD Bn)
Exhibit 6.70: Forecast of Rest of Asia Pacific (in USD Bn)
Exhibit 6.71: Forecast of Asia Pacific (in Mt)
Exhibit 6.72: Forecast of China (in Mt)
Exhibit 6.73: Forecast of India (in Mt)
Exhibit 6.74: Forecast of Japan (in Mt)
Exhibit 6.75: Forecast of Indonesia (in Mt)
Exhibit 6.76: Forecast of South Korea (in Mt)
Exhibit 6.77: Forecast of Australia (in Mt)
Exhibit 6.78: Forecast of Southeast Asia excluding Indonesia (in Mt)
Exhibit 6.79: Forecast of Rest of Asia Pacific (in Mt)
Exhibit 6.80: Forecast of Latin America (in USD Bn)
Exhibit 6.81: Forecast of Brazil (in USD Bn)
Exhibit 6.82: Forecast of Argentina (in USD Bn)
Exhibit 6.83: Forecast of Colombia (in USD Bn)
Exhibit 6.84: Forecast of Chile (in USD Bn)
Exhibit 6.85: Forecast of Rest of Latin America (in USD Bn)
Exhibit 6.86: Forecast of Latin America (in Mt)
Exhibit 6.87: Forecast of Brazil (in Mt)
Exhibit 6.88: Forecast of Argentina (in Mt)
Exhibit 6.89: Forecast of Colombia (in Mt)
Exhibit 6.90: Forecast of Chile (in Mt)
Exhibit 6.91: Forecast of Rest of Latin America (in Mt)
Exhibit 6.92: Forecast of Middle East and Africa (in USD Bn)
Exhibit 6.93: Forecast of Turkey (in USD Bn)
Exhibit 6.94: Forecast of Saudi Arabia (in USD Bn)
Exhibit 6.95: Forecast of South Africa (in USD Bn)
Exhibit 6.96: Forecast of Egypt (in USD Bn)
Exhibit 6.97: Forecast of United Arab Emirates (in USD Bn)
Exhibit 6.98: Forecast of Nigeria (in USD Bn)
Exhibit 6.99: Forecast of Rest of Middle East and Africa (in USD Bn)
Exhibit 6.100: Forecast of Middle East and Africa (in Mt)
Exhibit 6.101: Forecast of Turkey (in Mt)
Exhibit 6.102: Forecast of Saudi Arabia (in Mt)
Exhibit 6.103: Forecast of South Africa (in Mt)
Exhibit 6.104: Forecast of Egypt (in Mt)
Exhibit 6.105: Forecast of United Arab Emirates (in Mt)
Exhibit 6.106: Forecast of Nigeria (in Mt)
Exhibit 6.107: Forecast of Rest of Middle East and Africa (in Mt)
Total exhibits: 107

  1. Nestlé S.A.
  2. Unilever PLC
  3. Danone S.A.
  4. The Kraft Heinz Company
  5. General Mills, Inc.
  6. Mondelez International, Inc.
  7. The Hershey Company
  8. JBS S.A.
  9. Tyson Foods, Inc.
  10. The Coca-Cola Company
  11. PepsiCo, Inc.
  12. Keurig Dr Pepper Inc.
  13. Anheuser-Busch InBev SA/NV
  14. Heineken N.V.
  15. Diageo plc
  16. Pernod Ricard SA
  17. Carlsberg A/S
  18. Groupe Lactalis
  19. Fonterra Co-operative Group
  20. Arla Foods amba
  21. McDonald's Corporation
  22. Yum! Brands, Inc.
  23. Starbucks Corporation
  24. Restaurant Brands International Inc.
  25. Compass Group PLC.

Single User License (PDF)

  • This license allows for use of a publication by one person.
  • This person may print out a single copy of the publication.
  • This person can include information given in the publication in presentations and internal reports by providing full copyright credit to the publisher.
  • This person cannot share the publication (or any information contained therein) with any other person or persons.
  • Unless a Enterprise License is purchased, a Single User License must be purchased for every person that wishes to use the publication within the same organization.
  • Customers who infringe these license terms are liable for a Enterprise license fee.


Site License (PDF)*

  • This license allows for use of a publication by all users within one corporate location, e.g. a regional office.
  • These users may print out a single copy of the publication.
  • These users can include information given in the publication in presentations and internal reports by providing full copyright credit to the publisher.
  • These users cannot share the publication (or any information contained therein) with any other person or persons outside the corporate location for which the publication is purchased.
  • Unless a Enterprise License is purchased, a Site User License must be purchased for every corporate location by an organization that wishes to use the publication within the same organization.
  • Customers who infringe these license terms are liable for a Enterprise license fee.


Enterprise License (PDF)*

  • This license allows for use of a publication by unlimited users within the purchasing organization e.g. all employees of a single company.
  • Each of these people may use the publication on any computer, and may print out the report, but may not share the publication (or any information contained therein) with any other person or persons outside of the organization.
  • These employees of purchasing organization can include information given in the publication in presentations and internal reports by providing full copyright credit to the publisher.

*If Applicable.

About Us

NAVADHI is a market research company that helps global firms differentiate themselves, break market entry barriers, track their investments, develop business strategies and plan for future by providing actionable market research intelligence that helps them succeed.

Infomation

  • About Us
  • Publications
  • FAQs
  • Privacy Policy
  • Terms & Conditions
  • Careers
  • Press Releases
  • Contact

Source URL:https://www.navadhi.com/publications/global-food-beverage-industry-strategic-research-report-2026-2031

Links
[1] https://www.navadhi.com/countries/global
