
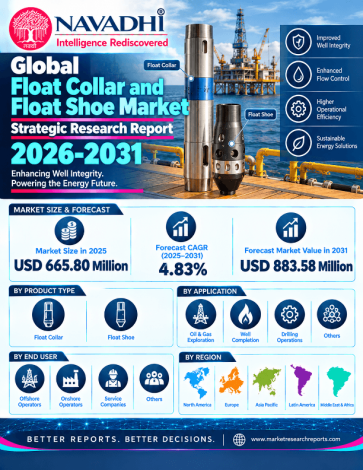

The global float collar and float shoe market is valued at US$665.8 million in 2025 and is forecast to reach US$883.6 million by 2031, a compound annual growth rate (CAGR) of 4.8% over 2025-2031. Unit volume is estimated at about 0.438 million units in 2025 at a blended average selling price of about US$1,521 per unit (a model estimate). The base blends a bottom-up model built on global well counts (about 70,000 wells drilled in 2023 per Rystad Energy), unit price evidence and channel assumptions with published third-party market sizes. No supplier discloses float collar or float shoe revenue, so the base is a model estimate and the report states its limits.
Float collars and float shoes are one-way check-valve casing accessories installed at the bottom of a casing or liner string during well construction. The float shoe guides the casing and prevents backflow of fluid and cement; the float collar sits one or two joints above and adds a redundant valve and a landing seat for cement plugs. The scope covers conventional, auto-fill, differential-fill, double-valve, HPHT and drillable designs at equipment price level. Guide shoes and reamer shoes without a float valve, centralizers, stage collars, cement plugs, liner hangers, tubulars and cementing services are excluded.
Scope of the Global Float Collar and Float Shoe Market Strategic Research Report
This report covers market value (US$ million) and unit volume (million units) for 2022-2031, with 2025 as the base year and 2026-2031 as the forecast period. It analyses product-type and onshore/offshore application segments, five regions and 20 countries, 10 profiled companies, competitive structure, Porter's Five Forces, PESTLE, SWOT and future trends. No company discloses float equipment revenue, so the report presents verified company facts and does not state company market shares or concentration ratios.
Segment by Type
Segment by Application
Who Can Use This Report?
1. Executive Summary
1.1.1 Market Definition and Scale
1.1.2 Principal Growth Drivers
1.1.3 Segment Highlights
1.1.4 Regional and Country Highlights
1.1.5 Competitive Structure and Key Corporate Developments
1.1.6 Principal Risks and Restraints
1.1.7 Outlook
2. Industry Overview & Forecast
2.1 Market Definition and Scope
2.2 Market Size and Historical Performance
2.3 Forecast and Growth Logic
2.4 Volume Analysis
2.5 Segment and Regional Market Composition
2.6 Value Chain and Pricing
3. Market Segmentation by Type
3.1 Overview of the Type Segmentation Framework
3.1.1 Float Collars
3.1.2 Float Shoes
3.2 Volume Analysis
3.3 Comparative Segment Dynamics and Mix-Shift Implications
4. Market Segmentation by Application
4.1 Overview and Segmentation Framework
4.1.1 Onshore
4.1.1.1 Segment Definition and Scope
4.1.1.2 Market Size, Share, and Forecast
4.1.1.3 Buyer Behaviour and Procurement Patterns
4.1.1.4 Risks
4.1.2 Offshore
4.1.2.1 Segment Definition and Scope
4.1.2.2 Market Size, Share, and Forecast
4.1.2.3 Buyer Behaviour and Procurement Patterns
4.1.2.4 Risks
4.2 Comparative Assessment
5. Regional Market Forecast
5.1 North America
5.1.1 Regional Overview
5.1.2 Key Growth Drivers
5.1.3 Regulatory & Infrastructure Landscape
5.1.4 Country-Level Analysis
5.1.5 Market Forecast 2025–2031
5.2 Europe
5.2.1 Regional Overview
5.2.2 Key Growth Drivers
5.2.3 Regulatory & Infrastructure Landscape
5.2.4 Country-Level Analysis
5.2.5 Market Forecast 2025–2031
5.3 Asia Pacific
5.3.1 Regional Overview
5.3.2 Key Growth Drivers
5.3.3 Regulatory & Infrastructure Landscape
5.3.4 Country-Level Analysis
5.3.5 Market Forecast 2025–2031
5.4 Latin America
5.4.1 Regional Overview
5.4.2 Key Growth Drivers
5.4.3 Regulatory & Infrastructure Landscape
5.4.4 Country-Level Analysis
5.4.5 Market Forecast 2025–2031
5.5 Middle East and Africa
5.5.1 Regional Overview
5.5.2 Key Growth Drivers
5.5.3 Regulatory & Infrastructure Landscape
5.5.4 Country-Level Analysis
5.5.5 Market Forecast 2025–2031
6. Country-Level Market Forecast
6.1 North America
6.1.1 United States
6.1.2 Canada
6.1.3 Mexico
6.1.4 Rest of North America
6.2 Europe
6.2.1 Russia
6.2.2 Norway
6.2.3 United Kingdom
6.2.4 Rest of Europe
6.3 Asia Pacific
6.3.1 China
6.3.2 India
6.3.3 Indonesia
6.3.4 Australia
6.3.5 Rest of Asia Pacific
6.4 Latin America
6.4.1 Brazil
6.4.2 Argentina
6.4.3 Colombia
6.4.4 Rest of Latin America
6.5 Middle East and Africa
6.5.1 Saudi Arabia
6.5.2 United Arab Emirates
6.5.3 Kuwait
6.5.4 Oman
6.5.5 Iraq
6.5.6 Nigeria
6.5.7 Egypt
6.5.8 Rest of Middle East and Africa
7. Growth Drivers & Inhibitors
7.1 Overview
7.2 Growth Drivers
7.2.1 Recovery in International Rig Activity Provides the Primary Volume Catalyst
7.2.2 North American Rig Reactivation Supports the Largest Regional Market
7.2.3 Offshore Development Drilling Drives Premium-Priced, Higher-Margin Demand
7.2.4 Development Drilling in Unconventional and Mature Field Redevelopment Programmes
7.2.5 Technological Differentiation Through HPHT and Auto-Fill Capability
7.2.6 Expanding Well Construction Programmes Across Asia Pacific and Middle East and
7.3 Market Inhibitors
7.3.1 Oilfield Service Revenue Contraction and Operator Capital Discipline Compress Demand
7.3.2 Structural Price Competition from Asian Manufacturers Erodes Margin and Market
7.3.3 Low Unit Value Creates Structural Market-Size Sensitivity to Well Count and Mix
7.3.4 Oil Price Volatility and Geopolitical Sanctions Disrupt Regional Activity Programmes
7.3.5 Market Fragmentation and Absence of Revenue Transparency Limit Competitive
7.4 Impact Assessment Summary
7.5 Integrated Assessment
8. Key Company Profiles
8.1 Halliburton Company
8.1.1 Company Overview
8.1.2 Key Products & Segments
8.1.3 Financial Performance (2023–2025)
8.1.4 Business Strategy
8.1.5 SWOT Analysis
8.1.6 Strategic Implications (2025–2031)
8.2 Baker Hughes Company
8.2.1 Company Overview
8.2.2 Key Products & Segments
8.2.3 Financial Performance (2023–2025)
8.2.4 Business Strategy
8.2.5 SWOT Analysis
8.2.6 Strategic Implications (2025–2031)
8.3 Weatherford International plc
8.3.1 Company Overview
8.3.2 Key Products & Segments
8.3.3 Financial Performance (2023–2025)
8.3.4 Business Strategy
8.3.5 SWOT Analysis
8.3.6 Strategic Implications (2025–2031)
8.4 Innovex International, Inc.
8.4.1 Company Overview
8.4.2 Key Products & Segments
8.4.3 Financial Performance (2023–2025)
8.4.4 Business Strategy
8.4.5 SWOT Analysis
8.4.6 Strategic Implications (2025–2031)
8.5 Forum Energy Technologies, Inc.
8.5.1 Company Overview
8.5.2 Key Products & Segments
8.5.3 Financial Performance (2023–2025)
8.5.4 Business Strategy
8.5.5 SWOT Analysis
8.5.6 Strategic Implications (2025–2031)
8.6 Expro Group Holdings N.V.
8.6.1 Company Overview
8.6.2 Key Products & Segments
8.6.3 Financial Performance (2023–2025)
8.6.4 Business Strategy
8.6.5 SWOT Analysis
8.6.6 Strategic Implications (2025–2031)
8.7 NCS Multistage Holdings, Inc.
8.7.1 Company Overview
8.7.2 Key Products & Segments
8.7.3 Financial Performance (2023–2025)
8.7.4 Business Strategy
8.7.5 SWOT Analysis
8.7.6 Strategic Implications (2025–2031)
8.8 NOV Inc.
8.8.1 Company Overview
8.8.2 Key Products & Segments
8.8.3 Financial Performance (2023–2025)
8.8.4 Business Strategy
8.8.5 SWOT Analysis
8.8.6 Strategic Implications (2025–2031)
8.9 Summit Casing Equipment
8.9.1 Company Overview
8.9.2 Key Products & Segments
8.9.3 Financial Performance (2023–2025)
8.9.4 Business Strategy
8.9.5 SWOT Analysis
8.9.6 Strategic Implications (2025–2031)
8.10 Puyang Zhongshi Group Co., Ltd.
8.10.1 Company Overview
8.10.2 Key Products & Segments
8.10.3 Financial Performance (2023–2025)
8.10.4 Business Strategy
8.10.5 SWOT Analysis
8.10.6 Strategic Implications (2025–2031)
9. Competitive Landscape
9.1 Competitive Landscape Overview
9.1.1 Market Structure and Data Constraints
9.1.2 Profiled Companies: Verified Facts (No Share Estimates)
9.1.3 Why Concentration Cannot Be Measured
9.1.4 Competitive Intensity Rating
9.2 Competitive Intensity Assessment
9.2.1 Qualitative Grouping Framework
9.2.2 Capacity versus Demand Dynamics
9.2.3 Pricing Environment
9.2.4 Barriers to Entry and Exit
9.3 Key Player Strategies & Positioning
9.3.1 Strategic Group Narrative
9.3.2 Differentiation Strategies
9.3.3 Geographic Strongholds
9.3.4 M&A and Partnership Activity (2022–Present)
9.3.5 R&D and Technology Investment Trends
9.4 Competitive Dynamics & Strategic Outlook
9.4.1 Structural Character of the Competitive Field
9.4.2 Emerging Competitive Threats
9.4.3 Consolidation vs. Fragmentation Outlook
9.4.4 Competitive Response Matrix
9.4.5 Strategic Recommendations for 2025–2031
10. Porter's Five Forces Analysis
10.1 Threat of New Entrants
10.2 Bargaining Power of Buyers
10.3 Bargaining Power of Suppliers
10.4 Threat of Substitutes
10.5 Competitive Rivalry
11. PESTLE Analysis
11.1 Overview and Analytical Framework
11.2 Political
11.3 Economic
11.4 Social
11.5 Technological
11.6 Legal and Regulatory
11.7 Environmental
11.8 PESTLE Summary Table
12. SWOT Analysis
12.1 Industry SWOT Analysis
12.1.1 Detailed Analysis
12.1.1.1 Strengths
12.1.1.2 Weaknesses
12.1.1.3 Opportunities
12.1.1.4 Threats
12.1.2 Strategic Implications and Priority Actions
13. Future Trends & Outlook
13.1 Trend Analysis: Eight Defining Forces Shaping the Market
13.1.1 Recovery and Rebalancing of International Drilling Activity
13.1.2 Proliferation of High-Pressure, High-Temperature Well Environments
13.1.3 Buoyancy-Assisted and Auto-Fill Technology Adoption
13.1.4 Latin America Emerging as the Fastest-Growing Regional Market
13.1.5 Consolidation Among Specialist Float Equipment Suppliers
13.1.6 Digitisation of Well Construction and Smart Cementing Accessories
13.1.7 Chinese Domestic Suppliers Expanding Addressable Price Tiers
13.1.8 Offshore Deepwater and Ultra-Deepwater Demand as a Structural Growth Driver
13.2 Trend Summary Table
13.3 Forward Outlook: 2026–2031
List of Exhibits
Exhibit 2.1: Forecast of Global Market YoY Growth Rate & CAGR Summary (in %)
Exhibit 2.2: Forecast of Global Market YoY Growth Rate & CAGR Summary (in %)
Exhibit 2.3: Forecast of Global (in USD Mn)
Exhibit 2.4: Forecast of North America (in USD Mn)
Exhibit 2.5: Forecast of Europe (in USD Mn)
Exhibit 2.6: Forecast of Asia Pacific (in USD Mn)
Exhibit 2.7: Forecast of Latin America (in USD Mn)
Exhibit 2.8: Forecast of Middle East and Africa (in USD Mn)
Exhibit 2.9: Forecast of Global (in Mn Units)
Exhibit 2.10: Forecast of North America (in Mn Units)
Exhibit 2.11: Forecast of Asia Pacific (in Mn Units)
Exhibit 2.12: Forecast of Latin America (in Mn Units)
Exhibit 2.13: Forecast of Middle East and Africa (in Mn Units)
Exhibit 3.14: Forecast of Float Collars (in USD Mn)
Exhibit 3.15: Forecast of Float Collars (in Mn Units)
Exhibit 3.16: Forecast of Float Shoes (in USD Mn)
Exhibit 3.17: Forecast of Float Shoes (in Mn Units)
Exhibit 4.18: Forecast of Onshore (in USD Mn)
Exhibit 4.19: Forecast of Onshore (in Mn Units)
Exhibit 4.20: Forecast of Offshore (in USD Mn)
Exhibit 4.21: Forecast of Offshore (in Mn Units)
Exhibit 6.22: Forecast of North America (in USD Mn)
Exhibit 6.23: Forecast of United States (in USD Mn)
Exhibit 6.24: Forecast of Canada (in USD Mn)
Exhibit 6.25: Forecast of Mexico (in USD Mn)
Exhibit 6.26: Forecast of Rest of North America (in USD Mn)
Exhibit 6.27: Forecast of North America (in Mn Units)
Exhibit 6.28: Forecast of United States (in Mn Units)
Exhibit 6.29: Forecast of Europe (in USD Mn)
Exhibit 6.30: Forecast of Russia (in USD Mn)
Exhibit 6.31: Forecast of Norway (in USD Mn)
Exhibit 6.32: Forecast of United Kingdom (in USD Mn)
Exhibit 6.33: Forecast of Rest of Europe (in USD Mn)
Exhibit 6.34: Forecast of Asia Pacific (in USD Mn)
Exhibit 6.35: Forecast of China (in USD Mn)
Exhibit 6.36: Forecast of India (in USD Mn)
Exhibit 6.37: Forecast of Indonesia (in USD Mn)
Exhibit 6.38: Forecast of Australia (in USD Mn)
Exhibit 6.39: Forecast of Rest of Asia Pacific (in USD Mn)
Exhibit 6.40: Forecast of Asia Pacific (in Mn Units)
Exhibit 6.41: Forecast of China (in Mn Units)
Exhibit 6.42: Forecast of Latin America (in USD Mn)
Exhibit 6.43: Forecast of Brazil (in USD Mn)
Exhibit 6.44: Forecast of Argentina (in USD Mn)
Exhibit 6.45: Forecast of Colombia (in USD Mn)
Exhibit 6.46: Forecast of Rest of Latin America (in USD Mn)
Exhibit 6.47: Forecast of Latin America (in Mn Units)
Exhibit 6.48: Forecast of Middle East and Africa (in USD Mn)
Exhibit 6.49: Forecast of Saudi Arabia (in USD Mn)
Exhibit 6.50: Forecast of United Arab Emirates (in USD Mn)
Exhibit 6.51: Forecast of Kuwait (in USD Mn)
Exhibit 6.52: Forecast of Oman (in USD Mn)
Exhibit 6.53: Forecast of Iraq (in USD Mn)
Exhibit 6.54: Forecast of Nigeria (in USD Mn)
Exhibit 6.55: Forecast of Egypt (in USD Mn)
Exhibit 6.56: Forecast of Rest of Middle East and Africa (in USD Mn)
Exhibit 6.57: Forecast of Middle East and Africa (in Mn Units)
*If Applicable.

NAVADHI is a market research company that helps global firms differentiate themselves, break market entry barriers, track their investments, develop business strategies and plan for future by providing actionable market research intelligence that helps them succeed.