
NAVADHI Market Research
Published on NAVADHI Market Research (https://www.navadhi.com)

Home > Global Feed Additives Market Strategic Research Report 2026-2031

Global Feed Additives Market Strategic Research Report 2026-2031

Global Feed Additives Market Strategic Research Report 2026-2031
Publication ID: 
NAV0926004
Publication Date: 
September 16, 2026
Pages: 
260
Countries: 
Global [1]
Please choose the suitable license type from above. More details are at given under tab "Report License Types" below.

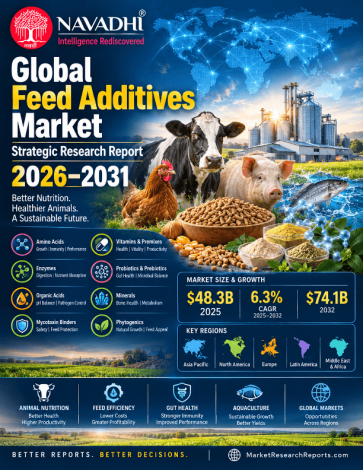
The global feed additives market was valued at approximately USD 48.3 billion in 2025 and is forecast to grow at a 6.3% CAGR in value terms through 2031, reaching an estimated USD 69.9 billion. In volume terms, total feed additive consumption stood at approximately 22.4 million metric tons in 2025, growing at a somewhat lower 4.8% CAGR \u2014 reflecting a structural shift toward higher-value, lower-inclusion-rate specialty additives (enzymes, phytogenics, targeted probiotics) relative to bulk commodity inputs (amino acids, minerals) over the forecast period. A bottom-up plausibility check on these figures shows an implied blended price of approximately USD 2.16 per kilogram in 2025, consistent with a market mix dominated by bulk amino acids and minerals priced in the USD 1\u20133/kg range, combined with a smaller high-value tail of vitamins and enzymes typically priced well above USD 10/kg.

Three structural forces are shaping the market through 2031. First, the accelerating global phase-out of antibiotic growth promoters across the European Union, the United States, and major exporting nations is generating sustained, structural demand for functional alternatives \u2014 organic acids, phytogenics, and probiotics \u2014 that replicate the growth-promotion and gut-health benefits previously delivered by antibiotics. Second, persistent feed grain price volatility is incentivizing greater adoption of precision enzyme and amino acid supplementation, where marginal investment yields measurable feed-conversion-ratio improvements. Third, the continued commercial expansion of aquaculture is creating a high-growth sub-market for specialized marine-species additive formulations.

Asia Pacific leads regionally at approximately 38% of global value share, anchored by China's position as the world's largest swine and poultry production base, alongside rapid aquaculture expansion in Southeast Asia and growing formalized commercial livestock production in India and Indonesia.

Corrected Competitive Landscape \u2014 Two Material Updates

Novozymes A/S and Chr. Hansen Holding A/S \u2014 previously listed as separate competitors \u2014 completed their merger into Novonesis in January 2024, and Novonesis has since further consolidated its position in feed enzymes specifically by acquiring dsm-firmenich's 50% stake in the Feed Enzymes Alliance for \u20ac1.5 billion (completed June 2025). Second, dsm-firmenich is in the process of fully exiting the animal nutrition business: following the Feed Enzymes Alliance sale, it announced in February 2026 the sale of its remaining Animal Nutrition & Health business to CVC Capital Partners for an enterprise value of approximately \u20ac2.2 billion, retaining only a 20% equity stake.

Scope of the Global Feed Additives Market Strategic Research Report

This report provides market sizing (value and volume) across additive type, animal species application, and regional/country segments through 2031, anchored to real market benchmarks and corrected for current competitive developments. Full country-level detail is provided for all 5 regions, including Latin America and Middle East & Africa.

Segment by Type

  • Amino Acids
  • Vitamins & Premixes
  • Enzymes
  • Probiotics & Prebiotics
  • Organic Acids & Acidifiers
  • Minerals & Trace Elements
  • Mycotoxin Binders & Detoxifiers
  • Phytogenics & Essential Oils
  • Antioxidants & Preservatives

Segment by Application

  • Poultry (Broilers, Layers & Turkeys)
  • Swine (Piglets, Growers & Sows)
  • Ruminants (Dairy, Beef & Small Ruminants)
  • Aquaculture (Finfish & Crustaceans)
  • Equine & Pet Animals

Who Can Use This Report?

This research report is ideal for people who need a granular, country-by-country view of the global feed additives market rather than aggregate headline narratives. Some of the intended users are:

  • Corporate strategy teams, investment analysts and M&A advisors evaluating the animal nutrition and specialty ingredients sector, including assessing the dsm-firmenich ANH divestiture and its acquirers
  • Procurement managers at feed manufacturers and integrated livestock producers
  • Trade and supply-chain professionals tracking cross-border feed-additive trade flows
  1. Executive Summary
    1. 1.1 Market Synopsis
    2. 1.2 Key Findings
    3. 1.3 Strategic Recommendations
  2. Industry Overview & Forecast
    1. 2.1 Market Definition & Scope
    2. 2.2 Market Value & Volume Forecast
    3. 2.2.1 Headline Value Trajectory
    4. 2.2.2 Volume Analysis
    5. 2.3 CAGR Analysis & Confidence Intervals
    6. 2.4 Historical Market Review
  3. Market Segmentation by Type
    1. 3.1 Chapter Overview
    2. 3.2 Volume Analysis
    3. 3.2.1 Global Feed Additives Market — Total Volume by Year
    4. 3.3 Amino Acids
    5. 3.3.1 Market Size and Forecast
    6. 3.3.2 Demand Dynamics and Competitive Context
    7. 3.4 Vitamins and Premixes
    8. 3.4.1 Market Size and Forecast
    9. 3.4.2 Demand Dynamics and Competitive Context
    10. 3.5 Minerals and Trace Elements
    11. 3.5.1 Market Size and Forecast
    12. 3.5.2 Demand Dynamics and Competitive Context
    13. 3.6 Enzymes
    14. 3.6.1 Market Size and Forecast
    15. 3.6.2 Demand Dynamics and Competitive Context
    16. 3.7 Probiotics and Prebiotics
    17. 3.7.1 Market Size and Forecast
    18. 3.7.2 Demand Dynamics and Competitive Context
    19. 3.8 Organic Acids and Acidifiers
    20. 3.8.1 Market Size and Forecast
    21. 3.8.2 Demand Dynamics and Competitive Context
    22. 3.9 Mycotoxin Binders and Detoxifiers
    23. 3.9.1 Market Size and Forecast
    24. 3.9.2 Demand Dynamics and Competitive Context
    25. 3.10 Phytogenics and Essential Oils
    26. 3.10.1 Market Size and Forecast
    27. 3.10.2 Demand Dynamics and Competitive Context
    28. 3.11 Antioxidants and Preservatives
    29. 3.11.1 Market Size and Forecast
    30. 3.11.2 Demand Dynamics and Competitive Context
    31. 3.12 Type Segmentation Summary
  4. Market Segmentation by Application
    1. 4.1 Overview and Sizing
    2. 4.2 Poultry — Broilers, Layers and Turkeys
    3. 4.3 Swine — Piglets, Growers and Sows
    4. 4.4 Ruminants — Dairy Cattle, Beef Cattle and Small Ruminants
    5. 4.5 Aquaculture — Finfish and Crustaceans
    6. 4.6 Equine and Pet Animals
    7. 4.7 Cross-Segment Synthesis and Forecast Implications
  5. Regional Market Forecast
    1. 5.1 Asia Pacific
    2. 5.1.1 Regional Overview
    3. 5.1.2 Key Growth Drivers
    4. 5.1.3 Regulatory & Infrastructure Landscape
    5. 5.1.4 Country-Level Analysis
    6. 5.1.5 Market Forecast 2025–2031
    7. 5.2 North America
    8. 5.2.1 Regional Overview
    9. 5.2.2 Key Growth Drivers
    10. 5.2.3 Regulatory & Infrastructure Landscape
    11. 5.2.4 Country-Level Analysis
    12. 5.2.5 Market Forecast 2025–2031
    13. 5.3 Europe
    14. 5.3.1 Regional Overview
    15. 5.3.2 Key Growth Drivers
    16. 5.3.3 Regulatory & Infrastructure Landscape
    17. 5.3.4 Country-Level Analysis
    18. 5.3.5 Market Forecast 2025–2031
    19. 5.4 Latin America
    20. 5.4.1 Regional Overview
    21. 5.4.2 Key Growth Drivers
    22. 5.4.3 Regulatory & Infrastructure Landscape
    23. 5.4.4 Country-Level Analysis
    24. 5.4.5 Market Forecast 2025–2031
    25. 5.5 Middle East & Africa
    26. 5.5.1 Regional Overview
    27. 5.5.2 Key Growth Drivers
    28. 5.5.3 Regulatory & Infrastructure Landscape
    29. 5.5.4 Country-Level Analysis
    30. 5.5.5 Market Forecast 2025–2031
  6. Country-Level Market Forecast
    1. 6.1 Asia Pacific
    2. 6.1.1 China
    3. 6.1.2 Japan
    4. 6.1.3 South Korea
    5. 6.1.4 Australia
    6. 6.1.5 Indonesia
    7. 6.1.6 India
    8. 6.1.7 Rest of Asia-Pacific
    9. 6.2 North America
    10. 6.2.1 USA
    11. 6.2.2 Canada
    12. 6.2.3 Mexico
    13. 6.2.4 Rest of North America
    14. 6.3 Europe
    15. 6.3.1 Germany
    16. 6.3.2 France
    17. 6.3.3 United Kingdom
    18. 6.3.4 Netherlands
    19. 6.3.5 Belgium
    20. 6.3.6 Rest of Europe
    21. 6.4 Latin America
    22. 6.4.1 Brazil
    23. 6.4.2 Rest of Latin America
    24. 6.5 Middle East & Africa
    25. 6.5.1 Saudi Arabia
    26. 6.5.2 South Africa
    27. 6.5.3 Rest of Middle East & Africa
  7. Growth Drivers & Inhibitors
    1. 7.1 Market Dynamics Overview
    2. 7.2 Antibiotic Growth Promoter Phase-Out
    3. 7.2.1 Regulatory Mandate as a Structural Demand Catalyst
    4. 7.2.2 Demand Displacement into Functional Alternative Categories
    5. 7.2.3 Geographic Roll-Out and Remaining Phase-Out Upside
    6. 7.3 Feed Grain Price Volatility and Precision Supplementation
    7. 7.3.1 Mechanism Linking Commodity Price Volatility to Additive Demand
    8. 7.3.2 Enzyme Supplementation Economics
    9. 7.3.3 Grain Price Volatility as a Cyclical Overlay on Structural Growth
    10. 7.4 Aquaculture Sector Expansion
    11. 7.4.1 Scale and Structural Growth Profile
    12. 7.4.2 Geographic Concentration and Market Access Dynamics
    13. 7.4.3 Competitive Implications of Aquaculture Sub-Market Growth
    14. 7.5 Market Restraints and Challenges
    15. 7.5.1 Regulatory Fragmentation Across Jurisdictions
    16. 7.5.2 Maximum Residue Limits and Trade Barrier Implications
    17. 7.5.3 Ownership Transition Risk: dsm-firmenich ANH Divestiture
    18. 7.5.4 Commodity Price Exposure in Bulk Additive Categories
    19. 7.6 Opportunities and White-Space Analysis
    20. 7.6.1 Strategic Opportunity: Post-Divestiture Competitive Repositioning
    21. 7.6.2 Strategic Opportunity: Specialty Additive Premiumization
    22. 7.6.3 Strategic Opportunity: Aquaculture-Specific Additive Formulation
    23. 7.6.4 Strategic Opportunity
    24. 7.7 Summary Assessment of Dynamic Balance
  8. Key Company Profiles
    1. 8.1 dsm-firmenich
    2. 8.1.1 Company Overview
    3. 8.1.2 Key Products & Segments
    4. 8.1.3 Financial Performance (2023–2025)
    5. 8.1.4 Business Strategy
    6. 8.1.5 SWOT Analysis
    7. 8.1.6 Strategic Implications (2025–2031)
    8. 8.2 Novonesis
    9. 8.2.1 Company Overview
    10. 8.2.2 Key Products & Segments
    11. 8.2.3 Financial Performance (2023–2025)
    12. 8.2.4 Business Strategy
    13. 8.2.5 SWOT Analysis
    14. 8.2.6 Strategic Implications (2025–2031)
    15. 8.3 Evonik Industries AG
    16. 8.3.1 Company Overview
    17. 8.3.2 Key Products & Segments
    18. 8.3.3 Financial Performance (2023–2025)
    19. 8.3.4 Business Strategy
    20. 8.3.5 SWOT Analysis
    21. 8.3.6 Strategic Implications (2025–2031)
    22. 8.4 BASF SE
    23. 8.4.1 Company Overview
    24. 8.4.2 Key Products & Segments
    25. 8.4.3 Financial Performance (2023–2025)
    26. 8.4.4 Business Strategy
    27. 8.4.5 SWOT Analysis
    28. 8.4.6 Strategic Implications (2025–2031)
    29. 8.5 Cargill Animal Nutrition
    30. 8.5.1 Company Overview
    31. 8.5.2 Key Products & Segments
    32. 8.5.3 Financial Performance (2023–2025)
    33. 8.5.4 Business Strategy
    34. 8.5.5 SWOT Analysis
    35. 8.5.6 Strategic Implications (2025–2031)
    36. 8.6 Adisseo
    37. 8.6.1 Company Overview
    38. 8.6.2 Key Products & Segments
    39. 8.6.3 Financial Performance (2023–2025)
    40. 8.6.4 Business Strategy
    41. 8.6.5 SWOT Analysis
    42. 8.6.6 Strategic Implications (2025–2031)
    43. 8.7 Alltech Inc.
    44. 8.7.1 Company Overview
    45. 8.7.2 Key Products & Segments
    46. 8.7.3 Financial Performance (2023–2025)
    47. 8.7.4 Business Strategy
    48. 8.7.5 SWOT Analysis
    49. 8.7.6 Strategic Implications (2025–2031)
    50. 8.8 Kemin Industries Inc.
    51. 8.8.1 Company Overview
    52. 8.8.2 Key Products & Segments
    53. 8.8.3 Financial Performance (2023–2025)
    54. 8.8.4 Business Strategy
    55. 8.8.5 SWOT Analysis
    56. 8.8.6 Strategic Implications (2025–2031)
    57. 8.9 Novus International Inc.
    58. 8.9.1 Company Overview
    59. 8.9.2 Key Products & Segments
    60. 8.9.3 Financial Performance (2023–2025)
    61. 8.9.4 Business Strategy
    62. 8.9.5 SWOT Analysis
    63. 8.9.6 Strategic Implications (2025–2031)
  9. Competitive Landscape
    1. 9.1 Competitive Landscape Overview
    2. 9.2 Competitive Intensity Assessment
    3. 9.2.1 Tier Classification and Revenue Profiles
    4. 9.2.2 Capacity Versus Demand Dynamics
    5. 9.2.3 Pricing Environment
    6. 9.2.4 Barriers to Entry and Exit
    7. 9.3 Key Player Strategies & Positioning
    8. 9.3.1 Strategic Group Mapping
    9. 9.3.2 Differentiation Strategies and Geographic Strongholds
    10. 9.3.3 R&D and Technology Investment Trends
    11. 9.4 Competitive Dynamics & Strategic Outlook
    12. 9.4.1 Emerging Competitive Threats
    13. 9.4.2 Consolidation vs. Fragmentation Outlook
    14. 9.4.3 Competitive Response Matrix
    15. 9.4.4 Strategic Recommendations for 2025–2031
  10. Porter's Five Forces Analysis
    1. 10.1 Threat of New Entrants
    2. 10.2 Bargaining Power of Buyers
    3. 10.2.1 Key Factors
    4. 10.2.2 Market-Specific Context
    5. 10.2.3 Trend
    6. 10.2.4 Strategic Implication
    7. 10.3 Bargaining Power of Suppliers
    8. 10.3.1 Key Factors
    9. 10.3.2 Market-Specific Context
    10. 10.3.3 Trend: Strengthening
    11. 10.3.4 Strategic Implication
    12. 10.4 Threat of Substitutes
    13. 10.4.1 Key Factors
    14. 10.4.2 Market-Specific Context
    15. 10.4.3 Trend: Gradually Strengthening
    16. 10.4.4 Strategic Implication
    17. 10.5 Competitive Rivalry
  11. PESTLE Analysis
    1. 11.1 Overview and Analytical Framework
    2. 11.2 Political
    3. 11.2.1 Food Security Policy and Protein Demand Imperatives
    4. 11.2.2 Trade Policy, Tariffs, and Geopolitical Fragmentation
    5. 11.2.3 Antibiotic Growth Promoter Bans and Political Mandates
    6. 11.3 Economic
    7. 11.3.1 Macro-Economic Drivers
    8. 11.3.2 Commodity Price Transmission and Input Cost Dynamics
    9. 11.3.3 Currency Risk and Emerging Market Pricing
    10. 11.3.4 Competitive Investment Cycles and M&A Economics
    11. 11.4 Sociocultural
    12. 11.4.1 Consumer Awareness, Clean Label, and the Animal Welfare Premium
    13. 11.4.2 Shifting Protein Consumption Patterns and Species-Mix Implicat…
    14. 11.4.3 Cultural and Religious Factors in Livestock Production
    15. 11.5 Technological
    16. 11.5.1 Fermentation Technology and Precision Biotechnology
    17. 11.5.2 Precision Livestock Farming and Data-Driven Additive Optimisation
    18. 11.5.3 Novel Additive Technologies
    19. 11.5.4 Digital Supply Chain and Traceability Technology
    20. 11.6 Legal and Regulatory
    21. 11.6.1 EU Regulatory Framework: The Most Comprehensive Jurisdiction
    22. 11.6.2 US Regulatory Framework: FDA, GRAS, and the CVM Pathway
    23. 11.6.3 China's Regulatory Trajectory
    24. 11.6.4 Registration Complexity in Emerging Markets and Regulatory Har…
    25. 11.6.5 Intellectual Property and Patent Landscape
    26. 11.7 Environmental
    27. 11.7.1 Sustainability Mandates and the Feed Additive Value Proposition
    28. 11.7.2 Climate Change: Acute Physical Risks and Adaptation Demand
    29. 11.7.3 Mycotoxin Risk Escalation and Climate-Driven Demand for Binders
    30. 11.7.4 Feed Ingredient Sustainability
    31. 11.8 Synthesis and Strategic Implications
  12. SWOT Analysis
    1. 12.1 Overview
    2. 12.2 Strengths
    3. 12.2.1 Structural Demand Insulation
    4. 12.2.2 Regulatory Tailwinds Functioning as Demand Creators
    5. 12.2.3 Precision Nutrition Economics
    6. 12.2.4 Aquaculture as a High-Growth Secular Vertical
    7. 12.2.5 Asia-Pacific's Production-Scale Advantage
    8. 12.3 Weaknesses
    9. 12.3.1 Raw Material Cost Exposure and Margin Compression Risk
    10. 12.3.2 Geographic Supply Concentration and Geopolitical Fragility
    11. 12.3.3 Regulatory Approval Complexity and Time-to-Market Friction
    12. 12.3.4 Customer Consolidation Compressing Pricing Power
    13. 12.4 Opportunities
    14. 12.4.1 Functional Additive Category Expansion Post-AGP Phase-Out
    15. 12.4.2 Synthetic Biology and Precision Fermentation as Innovation Vec…
    16. 12.4.3 Microbiome Science as a Platform for Next-Generation Probiotics
    17. 12.4.4 Aquaculture-Specific Premium Segment Development
    18. 12.4.5 Digital Precision Feeding Integration
    19. 12.4.6 Competitive Repositioning Created by dsm-firmenich's Exit
    20. 12.5 Threats
    21. 12.5.1 Private Equity Ownership of Key Assets Introducing Strategic U…
    22. 12.5.2 Commodity Substitution Risk in High-Volume Segments
    23. 12.5.3 Climate and Pandemic Biosecurity Risks to Livestock Sector Demand
    24. 12.5.4 Evolving Regulatory Frameworks in Key Markets
    25. 12.5.5 Talent and Intellectual Property Competition from Adjacent Ind…
    26. 12.6 Synthesis
  13. Future Trends & Outlook
    1. 13.1 Structural Trajectory of the Global Feed Additives Market Thro…
    2. 13.2 Specialty Additive Premiumization and the Value–Volume Diver…
    3. 13.3 Regulatory-Driven Demand Restructuring
    4. 13.4 Aquaculture as a Structurally Distinct High-Growth Sub-Market
    5. 13.5 Precision Nutrition, Data Integration, and the Digitalization…
    6. 13.6 Supply Chain Evolution and Regional Production Rebalancing
    7. 13.7 Competitive Landscape Reconfiguration
    8. 13.8 Regional Outlook and Growth Leadership Through 2031
    9. 13.9 Synthesis: Defining Themes for Strategic Planning Through 2031

List of Exhibits

  • 2.1 Exhibit 2.1: Forecast of Global Market YoY Growth Rate & CAGR Summary (in %)
  • 2.2 Exhibit 2.2: Forecast of Global Market YoY Growth Rate & CAGR Summary (in %)
  • 2.3 Exhibit 2.3: Forecast of Global (in USD Bn)
  • 2.4 Exhibit 2.4: Forecast of Asia Pacific (in USD Bn)
  • 2.5 Exhibit 2.5: Forecast of North America (in USD Bn)
  • 2.6 Exhibit 2.6: Forecast of Europe (in USD Bn)
  • 2.7 Exhibit 2.7: Forecast of Latin America (in USD Bn)
  • 2.8 Exhibit 2.8: Forecast of Middle East & Africa (in USD Bn)
  • 2.9 Exhibit 2.9: Forecast of Global (in mmt)
  • 2.10 Exhibit 2.10: Forecast of Asia Pacific (in mmt)
  • 2.11 Exhibit 2.11: Forecast of North America (in mmt)
  • 2.12 Exhibit 2.12: Forecast of Europe (in mmt)
  • 2.13 Exhibit 2.13: Forecast of Latin America (in mmt)
  • 2.14 Exhibit 2.14: Forecast of Middle East & Africa (in mmt)
  • 3.15 Exhibit 3.15: Forecast of Amino Acids (in USD Bn)
  • 3.16 Exhibit 3.16: Forecast of Organic Acids & Acidifiers (in USD Bn)
  • 3.17 Exhibit 3.17: Forecast of Amino Acids (in mmt)
  • 3.18 Exhibit 3.18: Forecast of Organic Acids & Acidifiers (in mmt)
  • 3.19 Exhibit 3.19: Forecast of Vitamins & Premixes (in USD Bn)
  • 3.20 Exhibit 3.20: Forecast of Vitamins & Premixes (in mmt)
  • 3.21 Exhibit 3.21: Forecast of Enzymes (in USD Bn)
  • 3.22 Exhibit 3.22: Forecast of Enzymes (in mmt)
  • 3.23 Exhibit 3.23: Forecast of Probiotics & Prebiotics (in USD Bn)
  • 3.24 Exhibit 3.24: Forecast of Probiotics & Prebiotics (in mmt)
  • 3.25 Exhibit 3.25: Forecast of Minerals & Trace Elements (in USD Bn)
  • 3.26 Exhibit 3.26: Forecast of Minerals & Trace Elements (in mmt)
  • 3.27 Exhibit 3.27: Forecast of Mycotoxin Binders & Detoxifiers (in USD Bn)
  • 3.28 Exhibit 3.28: Forecast of Mycotoxin Binders & Detoxifiers (in mmt)
  • 3.29 Exhibit 3.29: Forecast of Phytogenics & Essential Oils (in USD Bn)
  • 3.30 Exhibit 3.30: Forecast of Phytogenics & Essential Oils (in mmt)
  • 3.31 Exhibit 3.31: Forecast of Antioxidants & Preservatives (in USD Bn)
  • 3.32 Exhibit 3.32: Forecast of Antioxidants & Preservatives (in mmt)
  • 4.33 Exhibit 4.33: Forecast of Poultry (Broilers, Layers & Turkeys) (in USD Bn)
  • 4.34 Exhibit 4.34: Forecast of Poultry (Broilers, Layers & Turkeys) (in mmt)
  • 4.35 Exhibit 4.35: Forecast of Swine (Piglets, Growers & Sows) (in USD Bn) 4.35
  • 4.36 Exhibit 4.36: Forecast of Swine (Piglets, Growers & Sows) (in mmt)
  • 4.37 Exhibit 4.37: Forecast of Ruminants (Dairy, Beef & Small Ruminants) (in USD Bn)
  • 4.38 Exhibit 4.38: Forecast of Ruminants (Dairy, Beef & Small Ruminants) (in mmt)
  • 4.39 Exhibit 4.39: Forecast of Aquaculture (Finfish & Crustaceans) (in USD Bn)
  • 4.40 Exhibit 4.40: Forecast of Aquaculture (Finfish & Crustaceans) (in mmt)
  • 4.41 Exhibit 4.41: Forecast of Equine & Pet Animals (in USD Bn)
  • 4.42 Exhibit 4.42: Forecast of Equine & Pet Animals (in mmt)
  • 6.43 Exhibit 6.43: Forecast of Asia Pacific (in USD Bn)
  • 6.44 Exhibit 6.44: Forecast of China (in USD Bn)
  • 6.45 Exhibit 6.45: Forecast of Japan (in USD Bn)
  • 6.46 Exhibit 6.46: Forecast of South Korea (in USD Bn)
  • 6.47 Exhibit 6.47: Forecast of Australia (in USD Bn)
  • 6.48 Exhibit 6.48: Forecast of Indonesia (in USD Bn)
  • 6.49 Exhibit 6.49: Forecast of India (in USD Bn)
  • 6.50 Exhibit 6.50: Forecast of Rest of Asia-Pacific (in USD Bn)
  • 6.51 Exhibit 6.51: Forecast of Asia Pacific (in mmt)
  • 6.52 Exhibit 6.52: Forecast of China (in mmt)
  • 6.53 Exhibit 6.53: Forecast of Japan (in mmt)
  • 6.54 Exhibit 6.54: Forecast of South Korea (in mmt)
  • 6.55 Exhibit 6.55: Forecast of Australia (in mmt)
  • 6.56 Exhibit 6.56: Forecast of Indonesia (in mmt)
  • 6.57 Exhibit 6.57: Forecast of India (in mmt)
  • 6.58 Exhibit 6.58: Forecast of Rest of Asia-Pacific (in mmt)
  • 6.59 Exhibit 6.59: Forecast of North America (in USD Bn)
  • 6.60 Exhibit 6.60: Forecast of USA (in USD Bn)
  • 6.61 Exhibit 6.61: Forecast of Canada (in USD Bn)
  • 6.62 Exhibit 6.62: Forecast of Mexico (in USD Bn)
  • 6.63 Exhibit 6.63: Forecast of Rest of North America (in USD Bn)
  • 6.64 Exhibit 6.64: Forecast of North America (in mmt)
  • 6.65 Exhibit 6.65: Forecast of USA (in mmt)
  • 6.66 Exhibit 6.66: Forecast of Canada (in mmt)
  • 6.67 Exhibit 6.67: Forecast of Mexico (in mmt)
  • 6.68 Exhibit 6.68: Forecast of Rest of North America (in mmt)
  • 6.69 Exhibit 6.69: Forecast of Europe (in USD Bn)
  • 6.70 Exhibit 6.70: Forecast of Germany (in USD Bn)
  • 6.71 Exhibit 6.71: Forecast of France (in USD Bn)
  • 6.72 Exhibit 6.72: Forecast of United Kingdom (in USD Bn)
  • 6.73 Exhibit 6.73: Forecast of Netherlands (in USD Bn)
  • 6.74 Exhibit 6.74: Forecast of Belgium (in USD Bn)
  • 6.75 Exhibit 6.75: Forecast of Rest of Europe (in USD Bn)
  • 6.76 Exhibit 6.76: Forecast of Europe (in mmt)
  • 6.77 Exhibit 6.77: Forecast of Germany (in mmt)
  • 6.78 Exhibit 6.78: Forecast of France (in mmt)
  • 6.79 Exhibit 6.79: Forecast of United Kingdom (in mmt)
  • 6.80 Exhibit 6.80: Forecast of Netherlands (in mmt)
  • 6.81 Exhibit 6.81: Forecast of Belgium (in mmt)
  • 6.82 Exhibit 6.82: Forecast of Rest of Europe (in mmt)
  • 6.83 Exhibit 6.83: Forecast of Latin America (in USD Bn)
  • 6.84 Exhibit 6.84: Forecast of Rest of Latin America (in USD Bn)
  • 6.85 Exhibit 6.85: Forecast of Latin America (in mmt)
  • 6.86 Exhibit 6.86: Forecast of Rest of Latin America (in mmt)
  • 6.87 Exhibit 6.87: Forecast of Middle East & Africa (in USD Bn)
  • 6.88 Exhibit 6.88: Forecast of Rest of Middle East & Africa (in USD Bn)
  • 6.89 Exhibit 6.89: Forecast of Middle East & Africa (in mmt)
  • 6.90 Exhibit 6.90: Forecast of Rest of Middle East & Africa (in mmt)

Evonik Industries AG, Novonesis, dsm-firmenich AG, BASF SE, Cargill Animal Nutrition, Adisseo, Alltech Inc., Kemin Industries Inc., Novus International Inc.

Single User License (PDF)

  • This license allows for use of a publication by one person.
  • This person may print out a single copy of the publication.
  • This person can include information given in the publication in presentations and internal reports by providing full copyright credit to the publisher.
  • This person cannot share the publication (or any information contained therein) with any other person or persons.
  • Unless a Enterprise License is purchased, a Single User License must be purchased for every person that wishes to use the publication within the same organization.
  • Customers who infringe these license terms are liable for a Enterprise license fee.


Site License (PDF)*

  • This license allows for use of a publication by all users within one corporate location, e.g. a regional office.
  • These users may print out a single copy of the publication.
  • These users can include information given in the publication in presentations and internal reports by providing full copyright credit to the publisher.
  • These users cannot share the publication (or any information contained therein) with any other person or persons outside the corporate location for which the publication is purchased.
  • Unless a Enterprise License is purchased, a Site User License must be purchased for every corporate location by an organization that wishes to use the publication within the same organization.
  • Customers who infringe these license terms are liable for a Enterprise license fee.


Enterprise License (PDF)*

  • This license allows for use of a publication by unlimited users within the purchasing organization e.g. all employees of a single company.
  • Each of these people may use the publication on any computer, and may print out the report, but may not share the publication (or any information contained therein) with any other person or persons outside of the organization.
  • These employees of purchasing organization can include information given in the publication in presentations and internal reports by providing full copyright credit to the publisher.

*If Applicable.

About Us

NAVADHI is a market research company that helps global firms differentiate themselves, break market entry barriers, track their investments, develop business strategies and plan for future by providing actionable market research intelligence that helps them succeed.

Infomation

  • About Us
  • Publications
  • FAQs
  • Privacy Policy
  • Terms & Conditions
  • Careers
  • Press Releases
  • Contact

Source URL:https://www.navadhi.com/publications/global-feed-additives-market-strategic-research-report-2026-2031

Links
[1] https://www.navadhi.com/countries/global