NAVADHI Market Research
Published on NAVADHI Market Research (https://www.navadhi.com)

Home > Global e-Learning Market Research Report 2021 (By Technology, End User and Geography)

Global e-Learning Market Research Report 2021 (By Technology, End User and Geography)

Global e-Learning Market Research Report 2021
Publication ID: 
NAV0917001
Publication Date: 
September 12, 2017
Pages: 
121
Countries: 
Global [1]
Please choose the suitable license type from above. More details are at given under tab "Report License Types" below.
Global e-Learning Market Research Report 2021
E-learning is the rapidly growing market as education sector is actively increasing use of eLearning services due to its affordability, accessibility and mobility. E-Learning is also extensively used by corporate for training and development because of its low cost compared to the traditional training and availability of the high amount of quality content. Furthermore, governments and Public organizations are also utilizing e-Learning for the development and educational purposes.
 
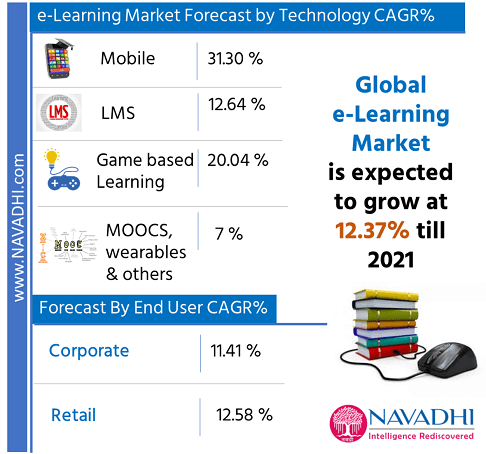
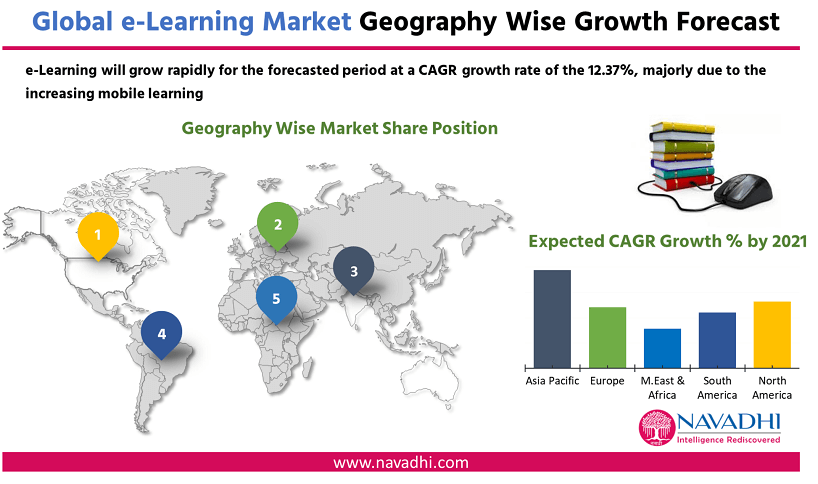
Global E Learning market has grown rapidly in last five years with the staggering CAGR growth of 18.15%. Major driving factors for the E Learning market has been increasing expenditure on education, increasing digitization, ease of accessibility and rapidly emerging markets of emerging countries.  
 
Currently, North America and Europe have the largest user base for E-Learning customers and almost all the big players in the industry are from this region only. Though markets of North America and Europe are not the fastest growing as they have already achieved maturity. Asia Pacific and Latin America are the third and fourth largest player, which are increasing at the above industry growth rate. E-Learning market is constantly evolving and shifting with the improvement in technology and new platforms. If the pace of innovation is not matched survival is very hard in this industry. Currently, Trends like cloud-based platforms for LMS, Mobile Learning, Gamification and personalized learning are driving the growth of the market. This new development has led to decline in the Self-paced learning, which consists of number large portion of the eLearning market with a high number of players. 
 
8 major companies have been covered in this report for accurately studying the market and understanding the need of the market, and to determine the growth drivers and inhibitors and trends followed in the Global E Learning Market.
 

What this report covers:

 
Global E Learning Market Forecast by Type of Technology:
  • Mobile E Learning 
  • Learning Management Systems (LMS)
  • Game bases Learning
  • MOOCS, wearables and others
 
Global E Learning Market Forecast by Position in Value Chain
  • Content Developer and Provider
  • Technology Enablers
  • Authoring Tool Providers
  • Service and Platform Provider
 
Global E Learning Market Forecast by End Users
  • Corporate Learning
  • Retail Learning
 
Global E-Learning Market Forecast by Geography
  • North America
  • South America
  • Middle East and Africa
  • Europe
  • Asia Pacific
 
Global e-Learning Market by Geography


Scope of the Report

  • This report provides a detailed view of Global E Learning Market.
  • This report identifies the need for Global E Learning Market.
  • This report provides detailed information on Global E Learning Market, with growth forecasts up to 2021.
  • The report identifies the growth drivers and inhibitors for E Learning Market. in world.
  • This report profiles top eight players related to Global E Learning Market.
  • This report provides detailed competitive landscape of Global E Learning Market.
  • This report identifies major challenges faced by a new player in Global E Learning Market.
  • The report identifies the key risks associated with Global E Learning Market.
  • This report provides future trends for Global E Learning Market.
  • This report also provides recommendations for policy makers and investors and helps other players sustain in this market.

1. Executive Summary

1.1 Scope of the Report
1.2 Research Methodology

2. Need for E Learning Market

3. Global E Learning Market - Overview

3.1 E Learning Market Industry Value Chain

4. Market Segments & Forecasts for Global E Learning Market

4.1 Overall Forecast for Global E Learning Market till 2021
4.2 Global E-Learning Market Forecast by Geography
4.2.1 North America
4.4.2 Latin America
4.4.3 Middle East and Africa
4.4.4 Europe
4.4.5 Asia Pacific
4.3 Global E Learning Market Forecast by Type of Technology
4.3.1 Mobile E Learning
4.3.2 Learning Management Systems
4.3.3 Game bases Learning
4.3.4 MOOCS, wearables and others
4.4 Global E Learning Market Forecast by Position in Value Chain
4.4.1 Content Market
4.4.2 Technology Enablers
4.4.3 Authoring Tool Providers
4.4.4 Service and Platform provider
4.5 Global E Learning Market Forecast by End Users
4.5.1 Corporate Learning
4.5.2 Retail Learning

5.Growth Drivers and Inhibitors for Global ELearning Market

5.1 Growth drivers
5.2 Growth Inhibitors

6. Risks associated with the Global E Learning Market

6.1 Credit Risk
6.2 Policy Risk (Government)
6.3 Technical Risk

7. Profile of Key Players in Global E-Learning Market

7.1 APOLLO EDUCATION GROUP, INC.
7.1.1 Company Profile
7.1.2 Value Chain
7.1.3 Financial Performance of Apollo Education Group, Inc.
7.1.4 Business Strategy
7.1.4.1 Product Level Business Strategy
7.1.4.2 Service Level Strategy
7.1.5 SWOT Analysis
  • Strengths
  • Weakness
  • Opportunities
  • Threats
7.2 NIIT Limited.
7.2.1 Company Profile
7.2.2 Value Chain
7.2.3 Financial Performance of NIIT Ltd.
7.2.4 Business Strategy
7.2.4.1 Product Level Business Strategy
7.2.4.2 Service Level Strategy
7.2.5 SWOT Analysis
  • Strengths
  • Weakness
  • Opportunities
  • Threats
7.3 Pearson PLC.
7.3.1 Company Profile
7.3.2 Value Chain
7.3.3 Financial Performance of Pearson PLC.
7.3.4 Business Strategy
7.3.4.1 Product Level Business Strategy
7.3.4.2 Service Level Strategy
7.3.5 SWOT Analysis
  • Strengths
  • Weakness
  • Opportunities
  • Threats
7.4 SAP SE
7.4.1 Company Profile
7.4.2 Value Chain
7.4.3 Financial Performance of SAP SE
7.4.4 Business Strategy
7.4.4.1 Product Level Business Strategy
7.4.4.2 Service Level Strategy
7.4.5 SWOT Analysis
  • Strengths
  • Weakness
  • Opportunities
  • Threats
7.5 Adobe systems Inc.
7.5.1 Company Profile
7.5.2 Value Chain
7.5.3 Financial Performance of Adobe systems Inc.
7.5.4 Business Strategy
7.5.4.1 Product Level Business Strategy
7.5.4.2 Service Level Strategy
7.5.5 SWOT Analysis
  • Strengths
  • Weakness
  • Opportunities
  • Threats
7.6 SkillSoft
7.6.1 Company Profile
7.6.2 Value Chain
7.6.3 Financial Performance of SkillSoft
7.6.4 Business Strategy
7.6.4.1 Product Level Business Strategy
7.6.4.2 Service Level Strategy
7.6.5 SWOT Analysis
  • Strengths
  • Weakness
  • Opportunities
  • Threats
7.7 Blackboard Inc.
7.7.1 Company Profile
7.7.2 Value Chain
7.7.3 Financial Performance of Blackboard Inc.
7.7.4 Business Strategy
7.7.4.1 Product Level Business Strategy
7.7.4.2 Service Level Strategy
7.7.5 SWOT Analysis
  • Strengths
  • Weakness
  • Opportunities
  • Threats
7.8 Instructure Inc.
7.8.1 Company Profile
7.8.2 Value Chain
7.8.3 Financial Performance of Instructure Inc.
7.8.4 Business Strategy
7.8.4.1 Product Level Business Strategy
7.8.4.2 Service Level Strategy
7.8.5 SWOT Analysis
  • Strengths
  • Weakness
  • Opportunities
  • Threats

8. Competitive Landscape in Global E-Learning Market

8.1 Merger and Acquisition

9. Associations Related to E-Learning Industry

9.1 IELA

10. Analysis Models

10.1 PESTLE analysis for the E-Learning Industry
10.1.1 Political
10.2.2 Economical
10.2.3 Social
10.2.4 Technological
10.2.5 Legal
10.2.6 Environmental
10.2 Porter Analysis Model
10.2.1 Threat of New Entrants
10.2.2 Threat of New Substitutes
10.2.3 Industry Rivalry
10.2.4 Bargaining Power of Customer
10.2.5 Bargaining Power of Supplier
10.3 SWOT Analysis
  • Strength
  • Weakness
  • Opportunities
  • Threats

11.Challenges Faced by New Players in E-Learning Market

12.Current and Future Trends in Global E-Learning Market

13. Case Studies

14. Strategic Recommendations

14.1 For Policy Makers
14.2 For End Users
14.3 For Service Providers
14.4 For Investors
15. Appendix

List of Exhibit

Abbreviations

Notes

Company Information

List of Exhibits:
Exhibit 3.1.1 Global E Learning Industry Value Chain        
Exhibit 4.1.1 Forecast of Global E Learning Market 2017-21 (in US$ billion)          
Exhibit 4.2.1 Global E Learning Market Share region wise 2016 (in %)                   
Exhibit 4.2.2 Geography Wise CAGR Growth Forecast for Global E Learning Market 2017-21 (in %)
Exhibit 4.2.3 Forecast of North America E Learning Market 2017-21 (in US$ billion)      
Exhibit 4.2.4 Forecast of E Learning Latin America Market 2017-21 (in US$ billion)      
Exhibit 4.2.5 Forecast of Middle East & Africa E Learning Market 2017-21 (in US$ billion)      
Exhibit 4.4.6 Forecast of European E Learning Market 2017-21 (in US$ billion)      
Exhibit 4.2.7 Forecast of Asia Pacific E Learning Market 2017-21 (in US$ billion)     
Exhibit 4.3.1 Global Market Share by Technology Type in E learning in 2016 (in %)    
Exhibit 4.3.2 Technology Wise CAGR Growth Forecast for Global E Learning Market 2017-21 (in %)
Exhibit 4.3.3 Growth Forecast for Technology Market in Global E Learning Market 2017-21 (in %)
Exhibit 4.3.4 Forecast of Mobile Learning Market 2017-21 (in US$ billion)      
Exhibit 4.3.5 Forecast of LMS Market 2017-21 (in US$ billion)         
Exhibit 4.3.6 Forecast of Game Learning Market 2017-21 (in US$ billion)
Exhibit 4.3.7 Forecast of MOOC, wearable and other Learning Market 2017-21 (in US$ billion)
Exhibit 4.4.1 Global Market Share by Position in Value Chain in E learning in 2016 (in %)    
Exhibit 4.4.2 CAGR Growth Forecast Based on Position in Value Chain in Global E Learning Market 2017-21 (in %)      
Exhibit 4.4.3 Forecast of Content Market in E Learning 2017-21 (in US$ billion)
Exhibit 4.4.4 Forecast of Technology Enablers in E Learning 2017-21 (in US$ billion)
Exhibit 4.4.5 Forecast of Authoring Tool Market in E Learning 2017-21 (in US$ billion)
Exhibit 4.4.6 Forecast of Service and Platform Provider Market in E Learning 2017-21 (in US$ billion)
Exhibit 4.5.1 Global Market Share by End User in E learning in 2016 (in %)    
Exhibit 4.5.2 CAGR Growth Forecast Based End User in Global E Learning Market 2017-21 (in %)
Exhibit 4.5.3 Forecast of Global Corporate Learning Market in E Learning 2017-21 (in US$ billion)
Exhibit 4.5.4 Forecast of Global Retail Learning Market in E Learning 2017-21 (in US$ billion) 
Exhibit 5.1 Growth Drivers and Inhibitors for E Learning market     
Exhibit 7.1.1 Company Profile – Apollo Education Group, Inc.               
Exhibit 7.1.2 Contact Details – Apollo Education Group, Inc.              
Exhibit 7.1.3 Apollo Education Group, Inc. ELearning Industry Value Chain
Exhibit 7.1.4 Apollo Education Group, Inc. 2011-12 to 2015-16 Revenue (in million USD)
Exhibit 7.1.5 Apollo Education Group, Inc. 2011-12 to 2015-16 Revenue Growth (in %)
Exhibit 7.1.6 Estimated revenue Growth of Apollo Education Group, Inc. from 2016-17 to 2020-21 (in USD)
Exhibit 7.1.7 Estimated revenue Growth of Apollo Education Group, Inc. from 2016-17 to 2020-21 (in %)
Exhibit 7.1.8 Major Products and Services of Apollo Education Group, Inc.      
Exhibit 7.1.9 SWOT Analysis of Apollo Education Group, Inc.              
Exhibit 7.2.1 Company Profile – NIIT Ltd.                    
Exhibit 7.2.2 Contact Details – NIIT Ltd.                     
Exhibit 7.2.3 NIIT Ltd. ELearning Industry Value Chain       
Exhibit 7.2.4 NIIT Ltd. 2011-12 to 2015-16 Revenue (in Million INR)            
Exhibit 7.2.5 NIIT Ltd.  2011-12 to 2015-16 Revenue Growth (in %)       
Exhibit 7.2.6 Estimated revenue Growth NIIT Ltd. from 2016-17 to 2020-21 (in Million INR)
Exhibit 7.2.7 Estimated revenue Growth of NIIT Ltd. from 2016-17 to 2020-21 (in %)             
Exhibit 7.2.8 Major Products and Services of NIIT Ltd.         
Exhibit 7.2.9 Business Mix of NIIT Ltd.         
Exhibit 7.2.10 SWOT Analysis of NIIT Ltd.                                       
Exhibit 7.3.1 Company Profile – Pearson PLC.                
Exhibit 7.3.2 Contact Details – Pearson Plc.                         
Exhibit 7.3.3 Pearson PLC. ELearning Industry Value Chain     
Exhibit 7.3.4 Pearson PLC.  2011-12 to 2015-16 Revenue (in Million Pound)             
Exhibit 7.3.5 Pearson PLC.   2011-12 to 2015-16 Revenue Growth (in %)         
Exhibit 7.3.6 Estimated revenue Growth Pearson PLC.  from 2016-17 to 2020-21 (in Million Pound)
Exhibit 7.3.7 Estimated revenue Growth of Pearson PLC. from 2016-17 to 2020-21 (in %)
Exhibit 7.3.8 Major Products and Services of Pearson PLC.     
Exhibit 7.3.9 SWOT Analysis of Pearson PLC.                                       
Exhibit 7.4.1 Company Profile – SAP SE                                                         
Exhibit 7.4.2 Contact Details – SAP SE                                                                   
Exhibit 7.4.3 SAP SE E Learning Industry Value Chain       
Exhibit 7.4.4 SAP SE  2011-12 to 2015-16 Revenue (in Million Euro)
Exhibit 7.4.5 SAP SE 2011-12 to 2015-16 Revenue Growth (in %)       
Exhibit 7.4.6 Estimated revenue Growth SAP SE from 2016-17 to 2020-21 (in Million Euro)
Exhibit 7.4.7 Estimated revenue Growth of SAP SE from 2016-17 to 2020-21 (in %)              
Exhibit 7.4.8 Major Products and Services of SAP SE       
Exhibit 7.4.9 SWOT Analysis of SAP SE                                       
Exhibit 7.5.1 Company Profile – Adobe systems Inc.                                      
Exhibit 7.5.2 Contact Details – Adobe systems Inc.                                     
Exhibit 7.5.3 Adobe systems Inc. in E Learning Industry Value Chain     
Exhibit 7.5.4 Adobe systems Inc.  2011-12 to 2015-16 Revenue (in Million Euro)   
Exhibit 7.5.5 Adobe systems Inc.2011-12 to 2015-16 Revenue Growth (in %)         
Exhibit 7.5.6 Estimated revenue Growth Adobe systems Inc. from 2016-17 to 2020-21 (in Million Euro)
Exhibit 7.5.7 Estimated revenue Growth of Adobe systems Inc. from 2016-17 to 2020-21 (in %)
Exhibit 7.5.8 Major Products and Services of Adobe systems Inc.        
Exhibit 7.5.9 SWOT Analysis of Adobe systems Inc.                                  
Exhibit 7.6.1 Company Profile – SkillSoft                                                
Exhibit 7.6.2 Contact Details – SkillSoft                                                
Exhibit 7.6.3 SkillSoft in E Learning Industry Value Chain       
Exhibit 7.6.4 SkillSoft 2011-12 to 2015-16 Revenue (in Million Dollar)   
Exhibit 7.6.5 SkillSoft 2011-12 to 2015-16 Revenue Growth (in %)         
Exhibit 7.6.6 Estimated revenue Growth SkillSoft from 2016-17 to 2020-21 (in Million Dollar)      
Exhibit 7.6.7 Estimated revenue Growth of SkillSoft from 2016-17 to 2020-21 (in %)              
Exhibit 7.6.8 Major Products and Services of SkillSoft        
Exhibit 7.6.9 SWOT Analysis of SkillSoft                                 
Exhibit 7.7.1 Company Profile – Blackboard Inc.                               
Exhibit 7.7.2 Contact Details – Blackboard Inc. 
Exhibit 7.7.3 Blackboard Inc. in E Learning Industry Value Chain       
Exhibit 7.7.4 Blackboard Inc. 2011-12 to 2015-16 Revenue (in Million Dollar)  
Exhibit 7.7.5 Blackboard Inc. 2011-12 to 2015-16 Revenue Growth (in %)          
Exhibit 7.7.6 Estimated revenue Growth Blackboard Inc. from 2016-17 to 2020-21 (in Million Dollar)
Exhibit 7.7.7 Estimated revenue Growth of Blackboard Inc. from 2016-17 to 2020-21 (in %)
Exhibit 7.7.8 Major Products and Services of Blackboard Inc.       
Exhibit 7.7.9 SWOT Analysis of Blackboard Inc.                                   
Exhibit 7.8.1 Company Profile – Instructure Inc.                                 
Exhibit 7.8.2 Contact Details – Instructure Inc.                                        
Exhibit 7.8.3 Instructure Inc. in E Learning Industry Value Chain     
Exhibit 7.8.4 Instructure Inc. 2011-12 to 2015-16 Revenue (in Million Dollar)   
Exhibit 7.8.5 Instructure Inc. 2011-12 to 2015-16 Revenue Growth (in %)          
Exhibit 7.8.6 Estimated revenue Growth Instructure Inc. from 2016-17 to 2020-21 (in Million Dollar)
Exhibit 7.8.7 Estimated revenue Growth of Instructure Inc. from 2016-17 to 2020-21 (in %)              
Exhibit 7.8.8 Major Products and Services of Instructure Inc.   
Exhibit 7.8.9 SWOT Analysis of Instructure Inc.
Exhibit 8.1 Competitive Landscape in Global E Learning Market          
Exhibit 10.2.1 Porter Analysis of Global E Learning Market                     
Exhibit 10.3.1 SWOT Analysis of Global E Learning Market
 
Abbreviations
LMS- Learning Management System
LCMS- Learning content management system
MOOCs- Massive online open Courses
SaaS- Software-as-a-Service
 
  1. APOLLO EDUCATION GROUP, INC.
  2. NIIT Limited.
  3. Pearson PLC.
  4. SAP SE
  5. Adobe systems Inc.
  6. SkillSoft
  7. Blackboard Inc.
  8. Instructure Inc.

Single User License (PDF)

  • This license allows for use of a publication by one person.
  • This person may print out a single copy of the publication.
  • This person can include information given in the publication in presentations and internal reports by providing full copyright credit to the publisher.
  • This person cannot share the publication (or any information contained therein) with any other person or persons.
  • Unless a Enterprise License is purchased, a Single User License must be purchased for every person that wishes to use the publication within the same organization.
  • Customers who infringe these license terms are liable for a Enterprise license fee.


Site License (PDF)*

  • This license allows for use of a publication by all users within one corporate location, e.g. a regional office.
  • These users may print out a single copy of the publication.
  • These users can include information given in the publication in presentations and internal reports by providing full copyright credit to the publisher.
  • These users cannot share the publication (or any information contained therein) with any other person or persons outside the corporate location for which the publication is purchased.
  • Unless a Enterprise License is purchased, a Site User License must be purchased for every corporate location by an organization that wishes to use the publication within the same organization.
  • Customers who infringe these license terms are liable for a Enterprise license fee.


Enterprise License (PDF)*

  • This license allows for use of a publication by unlimited users within the purchasing organization e.g. all employees of a single company.
  • Each of these people may use the publication on any computer, and may print out the report, but may not share the publication (or any information contained therein) with any other person or persons outside of the organization.
  • These employees of purchasing organization can include information given in the publication in presentations and internal reports by providing full copyright credit to the publisher.

*If Applicable.

About Us

NAVADHI is a market research company that helps global firms differentiate themselves, break market entry barriers, track their investments, develop business strategies and plan for future by providing actionable market research intelligence that helps them succeed.

Infomation

  • About Us
  • Publications
  • FAQs
  • Privacy Policy
  • Terms & Conditions
  • Careers
  • Press Releases
  • Contact

Source URL:https://www.navadhi.com/publications/global-e-learning-market-research-report-2021-technology-end-user-and-geography

Links
[1] https://www.navadhi.com/countries/global