
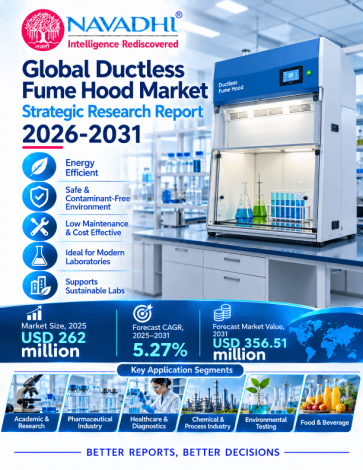

The global ductless fume hood market is valued at US$262.0 million in 2025 and is forecast to reach US$356.5 million by 2031, a compound annual growth rate (CAGR) of 5.3% over 2025-2031. The report covers new ductless (filtered, recirculating) laboratory fume hoods and filtered enclosures sold at manufacturer selling price. Ducted fume hoods, biological safety cabinets, laminar-flow cabinets, stand-alone air purifiers, ductwork, and replacement filters and services are excluded.
The report segments the market by three types and three applications across five regions and 27 countries and country groups. Standard Model is the largest type (52.6% of 2025 value) and With Secondary HEPA Filter is the fastest growing (6.7% CAGR). Industrial and Biomedical Research Labs is the largest application (51.2%) and also the fastest growing (5.7% CAGR). Asia Pacific is the largest region (41.0% of 2025 value) and the fastest growing (6.5% CAGR). Type, application, regional and country splits are estimates. The report covers 13 company profiles and gives no company market shares because ductless revenue is not disclosed.
Scope of the Global Ductless Fume Hood Market Strategic Research Report
This report covers market value (US$ million) for 2022-2031, with 2025 as the base year and 2026-2031 as the forecast period. It analyses three types, three applications, five regions and country-level markets, and includes company profiles, competitive landscape, Porter's Five Forces, PESTLE, SWOT and future trends. The market is value-only; no unit volumes are reported.
Segment by Type
Segment by Application
Who Can Use This Report?
1. Executive Summary
1.1 Market Definition and Scope
1.2 Market Size and Growth Trajectory
1.3 Principal Growth Drivers
1.4 Regional and Country Highlights
1.5 Competitive Structure and Key Company Observations
1.6 Principal Risks
1.7 Closing Outlook
2. Industry Overview & Forecast
2.1 Market Definition and Scope
2.2 Market Size and Historical Performance
2.3 Forecast Trajectory and Growth Logic
2.4 Regional and Segment Composition
2.5 Value Chain, Pricing, and Competitive Structure
3. Market Segmentation by Type
3.1 Overview of the Type Segmentation Framework
3.1.1 Standard Model
3.1.2 With Secondary Carbon Filter
3.1.3 With Secondary HEPA Filter
3.2 Comparative Analysis: Mix Shift and Strategic Implications
4. Market Segmentation by Application
4.1 Overview and Structural Context
4.1.1 Undergraduate Teaching Labs
4.1.2 Industrial and Biomedical Research Labs
4.1.3 Other Applications
4.1.4 Comparative Analysis Across Application Segments
5. Regional Market Forecast
5.1 North America
5.1.1 Regional Overview
5.1.2 Key Growth Drivers
5.1.3 Regulatory & Infrastructure Landscape
5.1.4 Country-Level Analysis
5.1.5 Market Forecast 2025–2031
5.2 Europe
5.2.1 Regional Overview
5.2.2 Key Growth Drivers
5.2.3 Regulatory & Infrastructure Landscape
5.2.4 Country-Level Analysis
5.2.5 Market Forecast 2025–2031
5.3 Asia Pacific
5.3.1 Regional Overview
5.3.2 Key Growth Drivers
5.3.3 Regulatory & Infrastructure Landscape
5.3.4 Country-Level Analysis
5.3.5 Market Forecast 2025–2031
5.4 Latin America
5.4.1 Regional Overview
5.4.2 Key Growth Drivers
5.4.3 Regulatory & Infrastructure Landscape
5.4.4 Country-Level Analysis
5.4.5 Market Forecast 2025–2031
5.5 Middle East and Africa
5.5.1 Regional Overview
5.5.2 Key Growth Drivers
5.5.3 Regulatory & Infrastructure Landscape
5.5.4 Country-Level Analysis
5.5.5 Market Forecast 2025–2031
6. Country-Level Market Forecast
6.1 North America
6.1.1 United States
6.1.2 Canada
6.1.3 Mexico
6.2 Europe
6.2.1 Germany
6.2.2 United Kingdom
6.2.3 France
6.2.4 Italy
6.2.5 Russia
6.2.6 Rest of Europe
6.3 Asia Pacific
6.3.1 China
6.3.2 Japan
6.3.3 South Korea
6.3.4 India
6.3.5 Australia
6.3.6 Southeast Asia
6.3.7 Rest of Asia Pacific
6.4 Latin America
6.4.1 Brazil
6.4.2 Argentina
6.4.3 Chile
6.4.4 Colombia
6.4.5 Rest of Latin America
6.5 Middle East and Africa
6.5.1 GCC Countries
6.5.2 Israel
6.5.3 Turkey
6.5.4 South Africa
6.5.5 Egypt
6.5.6 Rest of Middle East and Africa
7. Growth Drivers & Inhibitors
7.1 Market Dynamics Overview
7.2 Growth Drivers
7.2.1 Infrastructure Cost Elimination Drives Capital Budget Reallocation
7.2.2 Deployment Flexibility Unlocks Non-Traditional Laboratory Settings
7.2.3 Asia Pacific Laboratory Expansion Creates a High-Velocity Regional Growth Engine
7.2.4 Advances in Filter Monitoring and Chemical Validation Broaden Approved Application
7.2.5 Renovation and Retrofit Market Provides Structurally Recurring Demand
7.2.6 Expanding Supplier Ecosystem Reinforces Market Legitimacy and Buyer Access
7.3 Market Restraints
7.3.1 Chemical Scope Limitations Preserve a Structurally Protected Domain for Ducted Hoods
7.3.2 Recurring Filter, Testing, and Certification Costs Erode the Total-Cost Advantage
7.3.3 Divergent National Safety Standards and Institutional Policy Preferences Restrict Uniform
7.3.4 Market Size Estimation Uncertainty Weakens Buyer and Investor Confidence
7.3.5 Institutional Risk Aversion Creates Adoption Lag in High-Compliance Sectors
7.4 Driver and Restraint Impact Assessment
7.5 Integrated Assessment
8. Key Company Profiles
8.1 Thermo Fisher Scientific
8.1.1 Company Overview
8.1.2 Key Products & Segments
8.1.3 Financial Performance (2023–2025)
8.1.4 Business Strategy
8.1.5 SWOT Analysis
8.1.6 Strategic Implications (2025–2031)
8.2 AirClean Systems
8.2.1 Company Overview
8.2.2 Key Products & Segments
8.2.3 Financial Performance (2023–2025)
8.2.4 Business Strategy
8.2.5 SWOT Analysis
8.2.6 Strategic Implications (2025–2031)
8.3 Erlab
8.3.1 Company Overview
8.3.2 Key Products & Segments
8.3.3 Financial Performance (2023–2025)
8.3.4 Business Strategy
8.3.5 SWOT Analysis
8.3.6 Strategic Implications (2025–2031)
8.4 Terra Universal
8.4.1 Company Overview
8.4.2 Key Products & Segments
8.4.3 Financial Performance (2023–2025)
8.4.4 Business Strategy
8.4.5 SWOT Analysis
8.4.6 Strategic Implications (2025–2031)
8.5 ECOSAFE
8.5.1 Company Overview
8.5.2 Key Products & Segments
8.5.3 Financial Performance (2023–2025)
8.5.4 Business Strategy
8.5.5 SWOT Analysis
8.5.6 Strategic Implications (2025–2031)
8.6 Sentry Air Systems
8.6.1 Company Overview
8.6.2 Key Products & Segments
8.6.3 Financial Performance (2023–2025)
8.6.4 Business Strategy
8.6.5 SWOT Analysis
8.6.6 Strategic Implications (2025–2031)
8.7 Air Science
8.7.1 Company Overview
8.7.2 Key Products & Segments
8.7.3 Financial Performance (2023–2025)
8.7.4 Business Strategy
8.7.5 SWOT Analysis
8.7.6 Strategic Implications (2025–2031)
8.8 Dealye
8.8.1 Company Overview
8.8.2 Key Products & Segments
8.8.3 Financial Performance (2023–2025)
8.8.4 Business Strategy
8.8.5 SWOT Analysis
8.8.6 Strategic Implications (2025–2031)
8.9 Bigneat
8.9.1 Company Overview
8.9.2 Key Products & Segments
8.9.3 Financial Performance (2023–2025)
8.9.4 Business Strategy
8.9.5 SWOT Analysis
8.9.6 Strategic Implications (2025–2031)
8.10 Monmouth Scientific
8.10.1 Company Overview
8.10.2 Key Products & Segments
8.10.3 Financial Performance (2023–2025)
8.10.4 Business Strategy
8.10.5 SWOT Analysis
8.10.6 Strategic Implications (2025–2031)
8.11 Sunking
8.11.1 Company Overview
8.11.2 Key Products & Segments
8.11.3 Financial Performance (2023–2025)
8.11.4 Business Strategy
8.11.5 SWOT Analysis
8.11.6 Strategic Implications (2025–2031)
8.12 Kewaunee Scientific
8.12.1 Company Overview
8.12.2 Key Products & Segments
8.12.3 Financial Performance (2023–2025)
8.12.4 Business Strategy
8.12.5 SWOT Analysis
8.12.6 Strategic Implications (2025–2031)
8.13 Flow Sciences
8.13.1 Company Overview
8.13.2 Key Products & Segments
8.13.3 Financial Performance (2023–2025)
8.13.4 Business Strategy
8.13.5 SWOT Analysis
8.13.6 Strategic Implications (2025–2031)
9. Competitive Landscape
9.1 Competitive Landscape Overview
9.1.1 Profiled Companies: Verified Facts
9.1.2 Why Market Concentration Cannot Be Measured
9.1.3 Structural Observations from Available Evidence
9.2 Competitive Intensity Assessment
9.2.1 Competitive Groupings by Strategic Role
9.2.2 Capacity versus Demand Dynamics
9.2.3 Pricing Environment
9.2.4 Barriers to Entry and Exit
9.3 Key Player Strategies & Positioning
9.3.1 Strategic Group Mapping
9.3.2 Differentiation Strategies by Major Player
9.3.3 Geographic Strongholds
9.3.4 M&A and Partnership Activity, 2022–Present
9.3.5 R&D and Technology Investment Trends
9.4 Competitive Dynamics & Strategic Outlook
9.4.1 Emerging Competitive Threats
9.4.2 Consolidation vs. Fragmentation Outlook
9.4.3 Competitive Response Matrix
9.4.4 Strategic Recommendations for 2026–2031
10. Porter's Five Forces Analysis
10.1 Threat of New Entrants
10.2 Bargaining Power of Buyers
10.3 Bargaining Power of Suppliers
10.4 Threat of Substitutes
10.5 Competitive Rivalry
11. PESTLE Analysis
11.1 Strategic Environmental Assessment of the Global Ductless Fume Hood Market
11.2 Political
11.3 Economic
11.4 Sociocultural
11.5 Technological
11.6 Legal
11.7 Environmental
11.8 PESTLE Summary Assessment
12. SWOT Analysis
12.1.1 Detailed Analysis
12.1.1.1 Strengths
12.1.1.2 Weaknesses
12.1.1.3 Opportunities
12.1.1.4 Threats
12.1.2 Strategic Implications and Priority Actions
13. Future Trends & Outlook
13.1 Overview
13.2 Key Trends Shaping the Market Through 2031
13.2.1 Asia Pacific Demand Becoming the Dominant Growth Engine
13.2.2 Accelerating Adoption of Advanced Filtration Configurations
13.2.3 Industrial and Biomedical Research Labs Driving Application-Level Outperformance
13.2.4 Regulatory and EH&S Frameworks Simultaneously Constraining and Legitimizing Use
13.2.5 Competitive Bifurcation Between Premium Western Brands and Cost-Competitive Asian
13.2.6 Activated Carbon Supply Chain Stability Supporting Filter Manufacturing Continuity
13.2.7 Laboratory Furniture and Equipment Integration Creating Cross-Selling Opportunities
13.2.8 Scenario Divergence Signals Sensitivity to Macroeconomic and R&D Spending
13.3 Trend Summary Table
13.4 Forward Outlook
List of Exhibits
Exhibit 2.1: Forecast of Global Market YoY Growth Rate & CAGR Summary (in %)
Exhibit 2.2: Forecast of Global Market (in USD Mn)
Exhibit 2.3: Forecast of North America (in USD Mn)
Exhibit 2.4: Forecast of Europe (in USD Mn)
Exhibit 2.5: Forecast of Asia Pacific (in USD Mn)
Exhibit 2.6: Forecast of Latin America (in USD Mn)
Exhibit 2.7: Forecast of Middle East and Africa (in USD Mn)
Exhibit 3.8: Forecast of Standard Model (in USD Mn)
Exhibit 3.9: Forecast of With Secondary Carbon Filter (in USD Mn)
Exhibit 3.10: Forecast of With Secondary HEPA Filter (in USD Mn)
Exhibit 4.11: Forecast of Undergraduate Teaching Labs (in USD Mn)
Exhibit 4.12: Forecast of Industrial and Biomedical Research Labs (in USD Mn)
Exhibit 4.13: Forecast of Other (in USD Mn)
Exhibit 6.14: Forecast of North America (in USD Mn)
Exhibit 6.15: Forecast of United States (in USD Mn)
Exhibit 6.16: Forecast of Canada (in USD Mn)
Exhibit 6.17: Forecast of Mexico (in USD Mn)
Exhibit 6.18: Forecast of Europe (in USD Mn)
Exhibit 6.19: Forecast of Germany (in USD Mn)
Exhibit 6.20: Forecast of United Kingdom (in USD Mn)
Exhibit 6.21: Forecast of France (in USD Mn)
Exhibit 6.22: Forecast of Italy (in USD Mn)
Exhibit 6.23: Forecast of Russia (in USD Mn)
Exhibit 6.24: Forecast of Rest of Europe (in USD Mn)
Exhibit 6.25: Forecast of Asia Pacific (in USD Mn)
Exhibit 6.26: Forecast of China (in USD Mn)
Exhibit 6.27: Forecast of Japan (in USD Mn)
Exhibit 6.28: Forecast of South Korea (in USD Mn)
Exhibit 6.29: Forecast of India (in USD Mn)
Exhibit 6.30: Forecast of Australia (in USD Mn)
Exhibit 6.31: Forecast of Southeast Asia (in USD Mn)
Exhibit 6.32: Forecast of Rest of Asia Pacific (in USD Mn)
Exhibit 6.33: Forecast of Latin America (in USD Mn)
Exhibit 6.34: Forecast of Brazil (in USD Mn)
Exhibit 6.35: Forecast of Argentina (in USD Mn)
Exhibit 6.36: Forecast of Chile (in USD Mn)
Exhibit 6.37: Forecast of Colombia (in USD Mn)
Exhibit 6.38: Forecast of Rest of Latin America (in USD Mn)
Exhibit 6.39: Forecast of Middle East and Africa (in USD Mn)
Exhibit 6.40: Forecast of GCC Countries (in USD Mn)
Exhibit 6.41: Forecast of Israel (in USD Mn)
Exhibit 6.42: Forecast of Turkey (in USD Mn)
Exhibit 6.43: Forecast of South Africa (in USD Mn)
Exhibit 6.44: Forecast of Egypt (in USD Mn)
Exhibit 6.45: Forecast of Rest of Middle East and Africa (in USD Mn)
*If Applicable.

NAVADHI is a market research company that helps global firms differentiate themselves, break market entry barriers, track their investments, develop business strategies and plan for future by providing actionable market research intelligence that helps them succeed.