
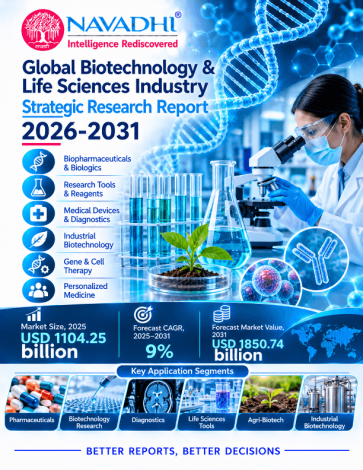

The global biotechnology and life sciences industry is valued at US$1,104.3 billion in 2025 and is forecast to reach US$1,850.7 billion by 2031, a compound annual growth rate (CAGR) of 9.0% over 2025-2031. The report covers what is sold across the biotechnology value chain: biologics and biosimilars, cell and gene therapies, life science tools and genomics platforms, contract research, biopharmaceutical contract manufacturing, in vitro diagnostics, agricultural biotechnology, industrial enzymes and fermentation products, and bioinformatics. Conventional small-molecule medicines, medical devices, hospital services, animal health, biofuels and food and beverage products are excluded. Values are Navadhi Market Research estimates anchored on published sizes and company results.
The report segments the industry by nine types and six applications across five regions and 26 countries and country groups. Biologics and Biosimilars is the largest type (50.4% of 2025 value) and Cell and Gene Therapies is the fastest growing (24.5% CAGR). Cardiovascular Metabolic and Chronic Diseases is the largest application (36.9%) and Rare and Genetic Disorders the fastest growing (about 10.0%). North America is the largest region (42.4% of 2025 value) and Asia Pacific the fastest growing (10.9% CAGR). Type, application and regional splits are estimates. The report profiles 40 companies and gives no company market shares.
Scope of the Global Biotechnology & Life Sciences Industry Strategic Research Report
This report covers market value (US$ million) for 2022-2031, with 2025 as the base year and 2026-2031 as the forecast period. It analyses nine types, six applications, five regions and country-level markets, and includes company profiles, competitive landscape, Porter's Five Forces, PESTLE, SWOT and future trends.
Segment by Type
Segment by Application
Who Can Use This Report?
1. Executive Summary
1.1 Market Definition and Scale
1.2 Principal Growth Drivers
1.3 Segment and Application Highlights
1.4 Regional and Country Highlights
1.5 Competitive Structure and Key Company Dynamics
1.6 Principal Risks
1.7 Outlook
2. Industry Overview & Forecast
2.1 Market Definition and Scope
2.2 Market Size and Historical Performance
2.3 Forecast Trajectory and Growth Logic
2.4 Segment and Pricing Dynamics Across the Value Chain
2.5 Regional Market Structure and Differential Growth
3. Market Segmentation by Type
3.1 Overview of the Type Framework
3.1.1 Biologics and Biosimilars
3.1.2 Cell and Gene Therapies
3.1.3 Life Science Tools and Genomics Platforms
3.1.4 Contract Research Services
3.1.5 Biopharmaceutical Contract Manufacturing
3.1.6 In Vitro Diagnostics
3.1.7 Agricultural Biotechnology
3.1.8 Industrial Enzymes and Fermentation Products
3.1.9 Bioinformatics and Computational Biology
3.1.10 Comparative Analysis and Structural Mix Shift
4. Market Segmentation by Application
4.1 Overview of the Application Framework
4.1.1 Cardiovascular Metabolic and Chronic Diseases
4.1.2 Oncology and Immuno-Oncology
4.1.3 Infectious Disease Prevention and Treatment
4.1.4 Rare and Genetic Disorders
4.1.5 Agricultural Crop Improvement and Food Security
4.1.6 Industrial and Environmental Biotechnology
4.2 Comparative Analysis Across Application Segments
5. Regional Market Forecast
5.1 North America
5.1.1 Regional Overview
5.1.2 Key Growth Drivers
5.1.3 Regulatory & Infrastructure Landscape
5.1.4 Country-Level Analysis
5.1.5 Market Forecast 2025–2031
5.2 Europe
5.2.1 Regional Overview
5.2.2 Key Growth Drivers
5.2.3 Regulatory & Infrastructure Landscape
5.2.4 Country-Level Analysis
5.2.5 Market Forecast 2025–2031
5.3 Asia Pacific
5.3.1 Regional Overview
5.3.2 Key Growth Drivers
5.3.3 Regulatory & Infrastructure Landscape
5.3.4 Country-Level Analysis
5.3.5 Market Forecast 2025–2031
5.4 Latin America
5.4.1 Regional Overview
5.4.2 Key Growth Drivers
5.4.3 Regulatory & Infrastructure Landscape
5.4.4 Country-Level Analysis
5.4.5 Market Forecast 2025–2031
5.5 Middle East and Africa
5.5.1 Regional Overview
5.5.2 Key Growth Drivers
5.5.3 Regulatory & Infrastructure Landscape
5.5.4 Country-Level Analysis
5.5.5 Market Forecast 2025–2031
6. Country-Level Market Forecast
6.1 North America
6.1.1 United States
6.1.2 Canada
6.1.3 Mexico
6.2 Europe
6.2.1 Germany
6.2.2 United Kingdom
6.2.3 France
6.2.4 Switzerland
6.2.5 Italy
6.2.6 Spain
6.2.7 Netherlands
6.2.8 Denmark
6.2.9 Rest of Europe
6.3 Asia Pacific
6.3.1 China
6.3.2 Japan
6.3.3 India
6.3.4 South Korea
6.3.5 Australia
6.3.6 Singapore
6.3.7 Taiwan
6.3.8 Rest of Asia Pacific
6.4 Latin America
6.4.1 Brazil
6.4.2 Argentina
6.4.3 Chile
6.4.4 Colombia
6.4.5 Rest of Latin America
6.5 Middle East and Africa
6.5.1 Saudi Arabia
6.5.2 United Arab Emirates
6.5.3 Israel
6.5.4 South Africa
6.5.5 Rest of Middle East and Africa
7. Growth Drivers & Inhibitors
7.1 Section Overview
7.2 Growth Drivers
7.3 Market Restraints
7.4 Impact Assessment Summary
7.5 Integrated Assessment
8. Key Company Profiles
8.1 Roche Holding
8.1.1 Company Overview
8.1.2 Key Products & Segments
8.1.3 Financial Performance (2023–2025)
8.1.4 Business Strategy
8.1.5 SWOT Analysis
8.1.6 Strategic Implications (2025–2031)
8.2 Pfizer
8.2.1 Company Overview
8.2.2 Key Products & Segments
8.2.3 Financial Performance (2023–2025)
8.2.4 Business Strategy
8.2.5 SWOT Analysis
8.2.6 Strategic Implications (2025–2031)
8.3 Novartis
8.3.1 Company Overview
8.3.2 Key Products & Segments
8.3.3 Financial Performance (2023–2025)
8.3.4 Business Strategy
8.3.5 SWOT Analysis
8.3.6 Strategic Implications (2025–2031)
8.4 Johnson & Johnson
8.4.1 Company Overview
8.4.2 Key Products & Segments
8.4.3 Financial Performance (2023–2025)
8.4.4 Business Strategy
8.4.5 SWOT Analysis
8.4.6 Strategic Implications (2025–2031)
8.5 AbbVie
8.5.1 Company Overview
8.5.2 Key Products & Segments
8.5.3 Financial Performance (2023–2025)
8.5.4 Business Strategy
8.5.5 SWOT Analysis
8.5.6 Strategic Implications (2025–2031)
8.6 Amgen
8.6.1 Company Overview
8.6.2 Key Products & Segments
8.6.3 Financial Performance (2023–2025)
8.6.4 Business Strategy
8.6.5 SWOT Analysis
8.6.6 Strategic Implications (2025–2031)
8.7 Gilead Sciences
8.7.1 Company Overview
8.7.2 Key Products & Segments
8.7.3 Financial Performance (2023–2025)
8.7.4 Business Strategy
8.7.5 SWOT Analysis
8.7.6 Strategic Implications (2025–2031)
8.8 Regeneron Pharmaceuticals
8.8.1 Company Overview
8.8.2 Key Products & Segments
8.8.3 Financial Performance (2023–2025)
8.8.4 Business Strategy
8.8.5 SWOT Analysis
8.8.6 Strategic Implications (2025–2031)
8.9 Vertex Pharmaceuticals
8.9.1 Company Overview
8.9.2 Key Products & Segments
8.9.3 Financial Performance (2023–2025)
8.9.4 Business Strategy
8.9.5 SWOT Analysis
8.9.6 Strategic Implications (2025–2031)
8.10 Moderna
8.10.1 Company Overview
8.10.2 Key Products & Segments
8.10.3 Financial Performance (2023–2025)
8.10.4 Business Strategy
8.10.5 SWOT Analysis
8.10.6 Strategic Implications (2025–2031)
8.11 BioNTech
8.11.1 Company Overview
8.11.2 Key Products & Segments
8.11.3 Financial Performance (2023–2025)
8.11.4 Business Strategy
8.11.5 SWOT Analysis
8.11.6 Strategic Implications (2025–2031)
8.12 Sanofi
8.12.1 Company Overview
8.12.2 Key Products & Segments
8.12.3 Financial Performance (2023–2025)
8.12.4 Business Strategy
8.12.5 SWOT Analysis
8.12.6 Strategic Implications (2025–2031)
8.13 AstraZeneca
8.13.1 Company Overview
8.13.2 Key Products & Segments
8.13.3 Financial Performance (2023–2025)
8.13.4 Business Strategy
8.13.5 SWOT Analysis
8.13.6 Strategic Implications (2025–2031)
8.14 Novo Nordisk
8.14.1 Company Overview
8.14.2 Key Products & Segments
8.14.3 Financial Performance (2023–2025)
8.14.4 Business Strategy
8.14.5 SWOT Analysis
8.14.6 Strategic Implications (2025–2031)
8.15 Eli Lilly
8.15.1 Company Overview
8.15.2 Key Products & Segments
8.15.3 Financial Performance (2023–2025)
8.15.4 Business Strategy
8.15.5 SWOT Analysis
8.15.6 Strategic Implications (2025–2031)
8.16 Merck & Co
8.16.1 Company Overview
8.16.2 Key Products & Segments
8.16.3 Financial Performance (2023–2025)
8.16.4 Business Strategy
8.16.5 SWOT Analysis
8.16.6 Strategic Implications (2025–2031)
8.17 Bristol Myers Squibb
8.17.1 Company Overview
8.17.2 Key Products & Segments
8.17.3 Financial Performance (2023–2025)
8.17.4 Business Strategy
8.17.5 SWOT Analysis
8.17.6 Strategic Implications (2025–2031)
8.18 CSL
8.18.1 Company Overview
8.18.2 Key Products & Segments
8.18.3 Financial Performance (2023–2025)
8.18.4 Business Strategy
8.18.5 SWOT Analysis
8.18.6 Strategic Implications (2025–2031)
8.19 Samsung Biologics
8.19.1 Company Overview
8.19.2 Key Products & Segments
8.19.3 Financial Performance (2023–2025)
8.19.4 Business Strategy
8.19.5 SWOT Analysis
8.19.6 Strategic Implications (2025–2031)
8.20 Celltrion
8.20.1 Company Overview
8.20.2 Key Products & Segments
8.20.3 Financial Performance (2023–2025)
8.20.4 Business Strategy
8.20.5 SWOT Analysis
8.20.6 Strategic Implications (2025–2031)
8.21 Thermo Fisher Scientific
8.21.1 Company Overview
8.21.2 Key Products & Segments
8.21.3 Financial Performance (2023–2025)
8.21.4 Business Strategy
8.21.5 SWOT Analysis
8.21.6 Strategic Implications (2025–2031)
8.22 Danaher
8.22.1 Company Overview
8.22.2 Key Products & Segments
8.22.3 Financial Performance (2023–2025)
8.22.4 Business Strategy
8.22.5 SWOT Analysis
8.22.6 Strategic Implications (2025–2031)
8.23 Agilent Technologies
8.23.1 Company Overview
8.23.2 Key Products & Segments
8.23.3 Financial Performance (2023–2025)
8.23.4 Business Strategy
8.23.5 SWOT Analysis
8.23.6 Strategic Implications (2025–2031)
8.24 Merck KGaA
8.24.1 Company Overview
8.24.2 Key Products & Segments
8.24.3 Financial Performance (2023–2025)
8.24.4 Business Strategy
8.24.5 SWOT Analysis
8.24.6 Strategic Implications (2025–2031)
8.25 Sartorius
8.25.1 Company Overview
8.25.2 Key Products & Segments
8.25.3 Financial Performance (2023–2025)
8.25.4 Business Strategy
8.25.5 SWOT Analysis
8.25.6 Strategic Implications (2025–2031)
8.26 Illumina
8.26.1 Company Overview
8.26.2 Key Products & Segments
8.26.3 Financial Performance (2023–2025)
8.26.4 Business Strategy
8.26.5 SWOT Analysis
8.26.6 Strategic Implications (2025–2031)
8.27 Bio-Rad Laboratories
8.27.1 Company Overview
8.27.2 Key Products & Segments
8.27.3 Financial Performance (2023–2025)
8.27.4 Business Strategy
8.27.5 SWOT Analysis
8.27.6 Strategic Implications (2025–2031)
8.28 Revvity
8.28.1 Company Overview
8.28.2 Key Products & Segments
8.28.3 Financial Performance (2023–2025)
8.28.4 Business Strategy
8.28.5 SWOT Analysis
8.28.6 Strategic Implications (2025–2031)
8.29 QIAGEN
8.29.1 Company Overview
8.29.2 Key Products & Segments
8.29.3 Financial Performance (2023–2025)
8.29.4 Business Strategy
8.29.5 SWOT Analysis
8.29.6 Strategic Implications (2025–2031)
8.30 IQVIA
8.30.1 Company Overview
8.30.2 Key Products & Segments
8.30.3 Financial Performance (2023–2025)
8.30.4 Business Strategy
8.30.5 SWOT Analysis
8.30.6 Strategic Implications (2025–2031)
8.31 ICON
8.31.1 Company Overview
8.31.2 Key Products & Segments
8.31.3 Financial Performance (2023–2025)
8.31.4 Business Strategy
8.31.5 SWOT Analysis
8.31.6 Strategic Implications (2025–2031)
8.32 Lonza
8.32.1 Company Overview
8.32.2 Key Products & Segments
8.32.3 Financial Performance (2023–2025)
8.32.4 Business Strategy
8.32.5 SWOT Analysis
8.32.6 Strategic Implications (2025–2031)
8.33 WuXi Biologics
8.33.1 Company Overview
8.33.2 Key Products & Segments
8.33.3 Financial Performance (2023–2025)
8.33.4 Business Strategy
8.33.5 SWOT Analysis
8.33.6 Strategic Implications (2025–2031)
8.34 Charles River Laboratories
8.34.1 Company Overview
8.34.2 Key Products & Segments
8.34.3 Financial Performance (2023–2025)
8.34.4 Business Strategy
8.34.5 SWOT Analysis
8.34.6 Strategic Implications (2025–2031)
8.35 Medpace
8.35.1 Company Overview
8.35.2 Key Products & Segments
8.35.3 Financial Performance (2023–2025)
8.35.4 Business Strategy
8.35.5 SWOT Analysis
8.35.6 Strategic Implications (2025–2031)
8.36 Abbott Laboratories
8.36.1 Company Overview
8.36.2 Key Products & Segments
8.36.3 Financial Performance (2023–2025)
8.36.4 Business Strategy
8.36.5 SWOT Analysis
8.36.6 Strategic Implications (2025–2031)
8.37 bioMerieux
8.37.1 Company Overview
8.37.2 Key Products & Segments
8.37.3 Financial Performance (2023–2025)
8.37.4 Business Strategy
8.37.5 SWOT Analysis
8.37.6 Strategic Implications (2025–2031)
8.38 Corteva
8.38.1 Company Overview
8.38.2 Key Products & Segments
8.38.3 Financial Performance (2023–2025)
8.38.4 Business Strategy
8.38.5 SWOT Analysis
8.38.6 Strategic Implications (2025–2031)
8.39 Novonesis
8.39.1 Company Overview
8.39.2 Key Products & Segments
8.39.3 Financial Performance (2023–2025)
8.39.4 Business Strategy
8.39.5 SWOT Analysis
8.39.6 Strategic Implications (2025–2031)
8.40 Schrodinger
8.40.1 Company Overview
8.40.2 Key Products & Segments
8.40.3 Financial Performance (2023–2025)
8.40.4 Business Strategy
8.40.5 SWOT Analysis
8.40.6 Strategic Implications (2025–2031)
9. Competitive Landscape
9.1 Competitive Landscape Overview
9.1.1 Industry Value at a Glance
9.1.2 Participant Profiles
9.1.3 Why Concentration Cannot Be Measured
9.1.4 Structural Characteristics of Competition
9.1.5 Overall Competitive Intensity
9.2 Competitive Intensity Assessment
9.2.1 Structural Grouping of Competitive Players
9.2.2 Capacity Versus Demand Dynamics
9.2.3 Pricing Environment
9.2.4 Barriers to Entry and Exit
9.3 Key Player Strategies & Positioning
9.3.1 Strategic Group Mapping
9.3.2 Selected Company Revenue Comparison, FY2024–FY2025
9.3.3 Differentiation Strategies
9.3.4 Contract and Tools Players
9.3.5 Agricultural and Industrial Biotechnology
9.3.6 Competitive Implications Through 2031
9.4 Competitive Dynamics & Strategic Outlook
9.4.1 The Competitive Terrain in 2025
9.4.2 Emerging Competitive Threats
9.4.3 Consolidation vs. Fragmentation Outlook
9.4.4 Competitive Response Matrix
9.4.5 Strategic Recommendations for 2026–2031
10. Porter's Five Forces Analysis
10.1 Threat of New Entrants
10.2 Bargaining Power of Buyers
10.3 Bargaining Power of Suppliers
10.4 Threat of Substitutes
10.5 Competitive Rivalry
11. PESTLE Analysis
11.1 Overview
11.2 Political
11.2.1 Government Pricing Reform and Reimbursement Pressure
11.2.2 Export Controls and Reagent Supply Risk
11.2.3 Regulatory Approval Timelines for Advanced Therapies
11.2.4 Rules for Laboratory-Developed Tests and Diagnostics Policy
11.3 Economic
11.3.1 Rising Global Medicine Spending as a Structural Demand Engine
11.3.2 Oncology as the Highest-Value and Fastest-Spending Application
11.3.3 GLP-1 and Obesity Therapy Economics Reshaping Pharma Revenue P…
11.3.4 Uneven Demand and Segment-Level Economic Volatility
11.4 Sociocultural
11.4.1 Chronic Disease Prevalence and the Cardiovascular-Metabolic Bu…
11.4.2 Patient Advocacy and the Rare Disease Treatment Imperative
11.4.3 Biosimilar Acceptance and Cost-Consciousness in Healthcare Sys…
11.5 Technological
11.5.1 Cell and Gene Therapy Manufacturing Scale-Up
11.5.2 Genomics and Sequencing Platform Demand
11.5.3 Computational Drug Discovery and Bioinformatics Growth
11.5.4 Outsourced Manufacturing Technology Intensity
11.6 Legal
11.6.1 Loss of Exclusivity and Biosimilar Legal Frameworks
11.6.2 Regulatory Compliance Burden for Advanced Therapy Manufacturing
11.6.3 Rules Governing Laboratory-Developed Tests and Diagnostic Regu…
11.7 Environmental
11.7.1 Agricultural Biotechnology and Food Security Demand
11.7.2 Industrial Enzymes and Fermentation as Green Chemistry Alterna…
11.7.3 Bioinformatics and the Resource Efficiency of In Silico Research
11.8 PESTLE Summary Table
12. SWOT Analysis
12.1.1 Detailed Analysis
12.1.1.1 Strengths
12.1.1.2 Weaknesses
12.1.1.3 Opportunities
12.1.1.4 Threats
12.1.2 Strategic Implications and Priority Actions
13. Future Trends & Outlook
13.1 Overview
13.2 Trend Analysis
13.2.1 Biologics and Biosimilars Consolidate Leadership as the Indust…
13.2.2 Cell and Gene Therapies Enter Commercial Scaling Phase
13.2.3 Bioinformatics and Computational Biology Drive Pipeline Effici…
13.2.4 Asia Pacific Emerges as the Industry's Fastest-Growing Regiona…
13.2.5 Oncology Sustains Its Position as the Dominant Application Market
13.2.6 Contract Manufacturing Expands on Outsourcing and Capacity Demand
13.2.7 Incretin and Metabolic Biology Reshape Cardiovascular and Chro…
13.2.8 Rare and Genetic Disorders Accelerate Through Gene Therapy Com…
13.3 Trend Summary Table
13.4 Forward Outlook: 2026–2031
List of Exhibits
Exhibit 2.1: Forecast of Global Market YoY Growth Rate & CAGR Summary (in %)
Exhibit 2.2: Forecast of Global Market (in USD Bn)
Exhibit 2.3: Forecast of North America (in USD Bn)
Exhibit 2.4: Forecast of Europe (in USD Bn)
Exhibit 2.5: Forecast of Asia Pacific (in USD Bn)
Exhibit 2.6: Forecast of Latin America (in USD Bn)
Exhibit 2.7: Forecast of Middle East and Africa (in USD Bn)
Exhibit 3.8: Forecast of Biologics and Biosimilars (in USD Bn)
Exhibit 3.9: Forecast of Cell and Gene Therapies (in USD Bn)
Exhibit 3.10: Forecast of Life Science Tools and Genomics Platforms (in USD Bn)
Exhibit 3.11: Forecast of Contract Research Services (in USD Bn)
Exhibit 3.12: Forecast of Biopharmaceutical Contract Manufacturing (in USD Bn)
Exhibit 3.13: Forecast of In Vitro Diagnostics (in USD Bn)
Exhibit 3.14: Forecast of Agricultural Biotechnology (in USD Bn)
Exhibit 3.15: Forecast of Industrial Enzymes and Fermentation Products (in USD Bn)
Exhibit 3.16: Forecast of Bioinformatics and Computational Biology (in USD Bn)
Exhibit 4.17: Forecast of Oncology and Immuno-Oncology (in USD Bn)
Exhibit 4.18: Forecast of Infectious Disease Prevention and Treatment (in USD Bn)
Exhibit 4.19: Forecast of Rare and Genetic Disorders (in USD Bn)
Exhibit 4.20: Forecast of Cardiovascular Metabolic and Chronic Diseases (in USD Bn)
Exhibit 4.21: Forecast of Agricultural Crop Improvement and Food Security (in USD Bn)
Exhibit 4.22: Forecast of Industrial and Environmental Biotechnology (in USD Bn)
Exhibit 6.23: Forecast of North America (in USD Bn)
Exhibit 6.24: Forecast of United States (in USD Bn)
Exhibit 6.25: Forecast of Canada (in USD Bn)
Exhibit 6.26: Forecast of Mexico (in USD Bn)
Exhibit 6.27: Forecast of Europe (in USD Bn)
Exhibit 6.28: Forecast of Germany (in USD Bn)
Exhibit 6.29: Forecast of United Kingdom (in USD Bn)
Exhibit 6.30: Forecast of France (in USD Bn)
Exhibit 6.31: Forecast of Switzerland (in USD Bn)
Exhibit 6.32: Forecast of Italy (in USD Bn)
Exhibit 6.33: Forecast of Spain (in USD Bn)
Exhibit 6.34: Forecast of Netherlands (in USD Bn)
Exhibit 6.35: Forecast of Denmark (in USD Bn)
Exhibit 6.36: Forecast of Rest of Europe (in USD Bn)
Exhibit 6.37: Forecast of Asia Pacific (in USD Bn)
Exhibit 6.38: Forecast of China (in USD Bn)
Exhibit 6.39: Forecast of Japan (in USD Bn)
Exhibit 6.40: Forecast of India (in USD Bn)
Exhibit 6.41: Forecast of South Korea (in USD Bn)
Exhibit 6.42: Forecast of Australia (in USD Bn)
Exhibit 6.43: Forecast of Singapore (in USD Bn)
Exhibit 6.44: Forecast of Taiwan (in USD Bn)
Exhibit 6.45: Forecast of Rest of Asia Pacific (in USD Bn)
Exhibit 6.46: Forecast of Latin America (in USD Bn)
Exhibit 6.47: Forecast of Brazil (in USD Bn)
Exhibit 6.48: Forecast of Argentina (in USD Bn)
Exhibit 6.49: Forecast of Chile (in USD Bn)
Exhibit 6.50: Forecast of Colombia (in USD Bn)
Exhibit 6.51: Forecast of Rest of Latin America (in USD Bn)
Exhibit 6.52: Forecast of Middle East and Africa (in USD Bn)
Exhibit 6.53: Forecast of Saudi Arabia (in USD Bn)
Exhibit 6.54: Forecast of United Arab Emirates (in USD Bn)
Exhibit 6.55: Forecast of Israel (in USD Bn)
Exhibit 6.56: Forecast of South Africa (in USD Bn)
Exhibit 6.57: Forecast of Rest of Middle East and Africa (in USD Bn)
*If Applicable.

NAVADHI is a market research company that helps global firms differentiate themselves, break market entry barriers, track their investments, develop business strategies and plan for future by providing actionable market research intelligence that helps them succeed.