
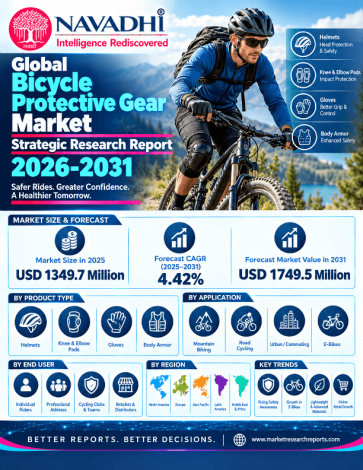

The global bicycle protective gear market is valued at approximately USD 1,349.7 million in 2025 and is projected to reach about USD 1,749.5 million by 2031, a compound annual growth rate of 4.4% over 2025-2031. Europe is the largest region at about USD 630.5 million in 2025 (46.7% of global value), followed by North America at USD 398.4 million and Asia Pacific at USD 253.8 million, the fastest-growing major region at a 6.4% CAGR.
Helmets account for about 66% of 2025 value (USD 891.7 million), with gloves, armor and pads, and other protective gear making up the rest; armor and pads is the fastest-growing type at about 6.6% a year as mountain biking and e-bike participation expand. By application, road and urban cycling holds about 59% of value, while mountain biking and off-road gains share toward 31% by 2031. The bear and bull cases reach USD 1,486 million and USD 2,050 million in 2031.
The report is built bottom-up from regional bicycle units, gear attachment rates and manufacturer-level average selling prices, cross-checked against published helmet-market estimates. Ten companies are profiled. Most do not disclose protective-gear revenue, so company revenues are shown only where a named source reports them and otherwise print as n/a.
Scope of the Global Bicycle Protective Gear Market Strategic Research Report 2026-2031
This report provides market value forecasts for 2022-2031 (base year 2025, forecast 2026-2031) by type, application, region and 26 country lines, together with company profiles, competitive landscape, Porter's Five Forces, PESTLE and SWOT analysis, and future trends.
Segment by Type
Segment by Application
Who Can Use This Report?
Helmet, armor and glove makers, bicycle and e-bike brands, distributors and retailers, investors, and consultants sizing cycling-safety markets or planning market entry.
| 1. Executive Summary 1.1 Market Definition and Headline Sizing 1.2 Key Growth Drivers 1.3 Segment Highlights 1.4 Regional and Country Highlights 1.5 Competitive Structure and Key Corporate Activity 1.6 Principal Risks 1.7 Outlook 2. Industry Overview & Forecast 2.1 Market Definition and Scope 2.2 Market Size and Historical Performance 2.3 Forecast and Growth Logic 2.4 Segment Analysis and Mix Evolution 2.5 Value Chain and Pricing Architecture 3. Market Segmentation by Type 3.1 Overview of the Type Segmentation Framework 3.1.1 Helmets 3.1.2 Gloves 3.1.3 Armor and Pads 3.1.4 Other Protective Gear 3.2 Comparative Mix-Shift Analysis 4. Market Segmentation by Application 4.1 Overview of the Application Framework 4.1.1 Road and Urban Cycling 4.1.2 Mountain Biking and Off-Road 4.1.3 Others (BMX, Kids and Track) 4.2 Comparative Analysis and Forecast Trajectory 5. Regional Market Forecast 5.1 North America 5.1.1 Regional Overview 5.1.2 Key Growth Drivers 5.1.3 Regulatory & Infrastructure Landscape 5.1.4 Country-Level Analysis 5.1.5 Market Forecast 2025–2031 5.2 Europe 5.2.1 Regional Overview 5.2.2 Key Growth Drivers 5.2.3 Regulatory & Infrastructure Landscape 5.2.4 Country-Level Analysis 5.2.5 Market Forecast 2025–2031 5.3 Asia Pacific 5.3.1 Regional Overview 5.3.2 Key Growth Drivers 5.3.3 Regulatory & Infrastructure Landscape 5.3.4 Country-Level Analysis 5.3.5 Market Forecast 2025–2031 5.4 Middle East and Africa 5.4.1 Regional Overview 5.4.2 Key Growth Drivers 5.4.3 Regulatory & Infrastructure Landscape 5.4.4 Country-Level Analysis 5.4.5 Market Forecast 2025–2031 5.5 Latin America 5.5.1 Regional Overview 5.5.2 Key Growth Drivers 5.5.3 Regulatory & Infrastructure Landscape 5.5.4 Country-Level Analysis 5.5.5 Market Forecast 2025–2031 6. Country-Level Market Forecast 6.1 North America 6.1.1 United States 6.1.2 Canada 6.1.3 Mexico 6.2 Europe 6.2.1 Germany 6.2.2 United Kingdom 6.2.3 France 6.2.4 Netherlands 6.2.5 Italy 6.2.6 Spain 6.2.7 Rest of Europe 6.3 Asia Pacific 6.3.1 China 6.3.2 Japan 6.3.3 Australia 6.3.4 India 6.3.5 South Korea 6.3.6 Rest of Asia Pacific 6.4 Middle East and Africa 6.4.1 GCC Countries 6.4.2 South Africa 6.4.3 Turkey 6.4.4 Israel 6.4.5 Rest of Middle East and Africa 6.5 Latin America 6.5.1 Brazil 6.5.2 Argentina 6.5.3 Chile 6.5.4 Colombia 6.5.5 Rest of Latin America 7. Growth Drivers & Inhibitors 7.1 Strategic Overview 7.2 Growth Drivers 7.2.1 Sustained Expansion of Mountain Biking and E-Mountain Biking Participation 7.2.2 Regulatory Mandates and the Progressive Extension of Helmet Legislation 7.2.3 Premium Product Innovation and Technology-Led Premiumisation 7.2.4 Urban Cycling Growth and Structural Adoption Uplift in Asia Pacific 7.2.5 E-Bike Proliferation Driving Full-Category Protective Equipment Demand 7.2.6 Professional Cycling's Halo Effect on Consumer Safety Standards 7.3 Restraints 7.3.1 Post-Pandemic Demand Normalisation and Retail Inventory Correction 7.3.2 Price Competition from Low-Cost Online Channels 7.3.3 Structurally Low Helmet-Use Rates in Major Emerging Regions 7.3.4 Fragmented and Divergent Regional Standards Creating Compliance Complexity 7.3.5 Consumer Price Sensitivity and Replacement-Cycle Resistance 7.4 Impact Assessment Summary 7.5 Integrated Assessment 8. Key Company Profiles 8.1 Revelyst (Bell, Giro, CamelBak) 8.1.1 Company Overview 8.1.2 Key Products & Segments 8.1.3 Financial Performance (2023–2025) 8.1.4 Business Strategy 8.1.5 SWOT Analysis 8.1.6 Strategic Implications (2025–2031) 8.2 Leatt Corporation 8.2.1 Company Overview 8.2.2 Key Products & Segments 8.2.3 Financial Performance (2023–2025) 8.2.4 Business Strategy 8.2.5 SWOT Analysis 8.2.6 Strategic Implications (2025–2031) 8.3 POC Sports 8.3.1 Company Overview 8.3.2 Key Products & Segments 8.3.3 Financial Performance (2023–2025) 8.3.4 Business Strategy 8.3.5 SWOT Analysis 8.3.6 Strategic Implications (2025–2031) 8.4 Kask S.p.A. 8.4.1 Company Overview 8.4.2 Key Products & Segments 8.4.3 Financial Performance (2023–2025) 8.4.4 Business Strategy 8.4.5 SWOT Analysis 8.4.6 Strategic Implications (2025–2031) 8.5 Lazer 8.5.1 Company Overview 8.5.2 Key Products & Segments 8.5.3 Financial Performance (2023–2025) 8.5.4 Business Strategy 8.5.5 SWOT Analysis 8.5.6 Strategic Implications (2025–2031) 8.6 uvex sports 8.6.1 Company Overview 8.6.2 Key Products & Segments 8.6.3 Financial Performance (2023–2025) 8.6.4 Business Strategy 8.6.5 SWOT Analysis 8.6.6 Strategic Implications (2025–2031) 8.7 Giant Manufacturing 8.7.1 Company Overview 8.7.2 Key Products & Segments 8.7.3 Financial Performance (2023–2025) 8.7.4 Business Strategy 8.7.5 SWOT Analysis 8.7.6 Strategic Implications (2025–2031) 8.8 Specialized Bicycle Components 8.8.1 Company Overview 8.8.2 Key Products & Segments 8.8.3 Financial Performance (2023–2025) 8.8.4 Business Strategy 8.8.5 SWOT Analysis 8.8.6 Strategic Implications (2025–2031) 8.9 Trek Bicycle Corporation 8.9.1 Company Overview 8.9.2 Key Products & Segments 8.9.3 Financial Performance (2023–2025) 8.9.4 Business Strategy 8.9.5 SWOT Analysis 8.9.6 Strategic Implications (2025–2031) 8.10 Scott Sports SA 8.10.1 Company Overview 8.10.2 Key Products & Segments 8.10.3 Financial Performance (2023–2025) 8.10.4 Business Strategy 8.10.5 SWOT Analysis 8.10.6 Strategic Implications (2025–2031) 9. Competitive Landscape 9.1 Competitive Landscape Overview 9.1.1 Market Concentration and Structure 9.1.2 Leading Competitor Profiles and Strategic Positioning 9.1.3 Competitive Intensity Snapshot 9.2 Competitive Intensity Assessment 9.2.1 Market Architecture and Tier Classification 9.2.2 Tier 1 Players: Scale, Multi-Brand Portfolios, and Channel Power 9.2.3 Tier 2 Players 9.2.4 Tier 3 Dynamics 9.2.5 Capacity vs. Demand Dynamics 9.2.6 Pricing Environment: Three Distinct Tiers 9.2.7 Barriers to Entry and Exit 9.2.8 Competitive Intensity Summary 9.3 Key Player Strategies & Positioning 9.3.1 Strategic Group Map Narrative 9.3.2 Differentiation Strategies Across Major Players 9.3.3 Geographic Strongholds 9.3.4 M&A and Partnership Activity (2022–Present) 9.3.5 R&D and Technology Investment Trends 9.4 Competitive Dynamics & Strategic Outlook 9.4.1 The Evolving Competitive Landscape 9.4.2 Emerging Competitive Threats 9.4.3 Consolidation vs. Fragmentation Outlook 9.4.4 Competitive Response Matrix 9.4.5 Strategic Recommendations for 2025–2031 9.4.6 Outlook Summary 10. Porter's Five Forces Analysis 10.1 Threat of New Entrants 10.2 Bargaining Power of Buyers 10.3 Bargaining Power of Suppliers 10.4 Threat of Substitutes 10.5 Competitive Rivalry 11. PESTLE Analysis 11.1 Strategic Environmental Assessment of the Global Bicycle Protective Gear Market 11.2 Political 11.3 Economic 11.4 Social 11.5 Technological 11.6 Legal 11.7 Environmental 11.8 PESTLE Summary Assessment 12. SWOT Analysis 12.1.1 SWOT Summary Matrix 12.1.2 Detailed Analysis 12.1.2.1 Strengths 12.1.2.2 Weaknesses 12.1.2.3 Opportunities 12.1.2.4 Threats 12.1.3 Strategic Implications 13. Future Trends & Outlook 13.1 Key Trends Shaping the Market Through 2031 13.1.1 E-Bike Proliferation as a Primary Demand Catalyst 13.1.2 Legislative Mandates and Regulatory Expansion 13.1.3 Premiumisation and Technology-Embedded Helmet Innovation 13.1.4 Mountain Biking and Gravity Sports Driving Armor Adoption 13.1.5 Urbanisation and Active Mobility Infrastructure Investment 13.1.6 Supply Chain Reshoring and Manufacturing Diversification 13.1.7 Direct-to-Consumer Channel Expansion and Digital Brand Building 13.2 Trend Summary Table 13.3 Forward Outlook List of Exhibits Exhibit 2.1: Forecast of Global Market YoY Growth Rate & CAGR Summary (in %) Exhibit 2.2: Forecast of Global (in USD Bn) Exhibit 2.3: Forecast of North America (in USD Bn) Exhibit 2.4: Forecast of Europe (in USD Bn) Exhibit 2.5: Forecast of Asia Pacific (in USD Bn) Exhibit 2.6: Forecast of Middle East and Africa (in USD Bn) Exhibit 2.7: Forecast of Latin America (in USD Bn) Exhibit 3.8: Forecast of Helmets (in USD Bn) Exhibit 3.9: Forecast of Gloves (in USD Bn) Exhibit 3.10: Forecast of Armor and Pads (in USD Bn) Exhibit 3.11: Forecast of Other (in USD Bn) Exhibit 4.12: Forecast of Road and Urban Cycling (in USD Bn) Exhibit 4.13: Forecast of Mountain Biking and Off-Road (in USD Bn) Exhibit 4.14: Forecast of Others (in USD Bn) Exhibit 6.15: Forecast of North America (in USD Bn) Exhibit 6.16: Forecast of United States (in USD Bn) Exhibit 6.17: Forecast of Canada (in USD Bn) Exhibit 6.18: Forecast of Mexico (in USD Bn) Exhibit 6.19: Forecast of Europe (in USD Bn) Exhibit 6.20: Forecast of Germany (in USD Bn) Exhibit 6.21: Forecast of United Kingdom (in USD Bn) Exhibit 6.22: Forecast of France (in USD Bn) Exhibit 6.23: Forecast of Netherlands (in USD Bn) Exhibit 6.24: Forecast of Italy (in USD Bn) Exhibit 6.25: Forecast of Spain (in USD Bn) Exhibit 6.26: Forecast of Rest of Europe (in USD Bn) Exhibit 6.27: Forecast of Asia Pacific (in USD Bn) Exhibit 6.28: Forecast of China (in USD Bn) Exhibit 6.29: Forecast of Japan (in USD Bn) Exhibit 6.30: Forecast of Australia (in USD Bn) Exhibit 6.31: Forecast of India (in USD Bn) Exhibit 6.32: Forecast of South Korea (in USD Bn) Exhibit 6.33: Forecast of Rest of Asia Pacific (in USD Bn) Exhibit 6.34: Forecast of Middle East and Africa (in USD Bn) Exhibit 6.35: Forecast of GCC Countries (in USD Bn) Exhibit 6.36: Forecast of South Africa (in USD Bn) Exhibit 6.37: Forecast of Turkey (in USD Bn) Exhibit 6.38: Forecast of Israel (in USD Bn) Exhibit 6.39: Forecast of Rest of Middle East and Africa (in USD Bn) Exhibit 6.40: Forecast of Latin America (in USD Bn) Exhibit 6.41: Forecast of Brazil (in USD Bn) Exhibit 6.42: Forecast of Argentina (in USD Bn) Exhibit 6.43: Forecast of Chile (in USD Bn) Exhibit 6.44: Forecast of Colombia (in USD Bn) Exhibit 6.45: Forecast of Rest of Latin America (in USD Bn) |
*If Applicable.

NAVADHI is a market research company that helps global firms differentiate themselves, break market entry barriers, track their investments, develop business strategies and plan for future by providing actionable market research intelligence that helps them succeed.