
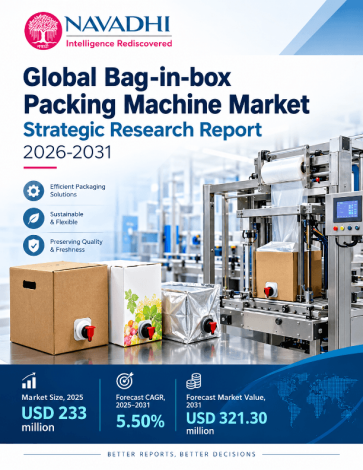

The global bag-in-box packing machine market is valued at US$233.0 million in 2025 and is forecast to reach US$321.3 million by 2031, a compound annual growth rate (CAGR) of 5.5% over 2025-2031. Machine shipments are estimated at about 5.9 thousand units in 2025, rising to about 7.9 thousand units by 2031. Published third-party estimates for this market range from roughly US$201 million to US$2.9 billion because no audited industry sales series exists and suppliers bundle fillers with bag and fitment supply, so the report adopts a blended bottom-up and top-down estimate and states its confidence level.
A bag-in-box packing machine fills liquid and semi-liquid products such as wine, juice, dairy, liquid egg, syrups, detergents and industrial fluids into flexible inner bags that sit in a rigid outer carton. The scope covers non-aseptic and aseptic fillers and integrated filling lines. Bags, taps and fitments, spare parts and service are excluded.
Scope of the Global Bag-in-box Packing Machine Market Strategic Research Report
This report covers market value (US$ million) and machine volume (thousand units) for 2022-2031, with 2025 as the base year and 2026-2031 as the forecast period. It analyses technology and application segments, five regions and the countries within them, eight profiled suppliers, competitive structure, Porter's Five Forces, PESTLE, SWOT and future trends. No company discloses bag-in-box machine sales, so the report presents verified supplier facts and does not state company market shares.
Segment by Type
Segment by Application
Who Can Use This Report?
1. Executive Summary
1.1.1 Market Definition and Sizing
1.1.2 Primary Growth Drivers
1.1.3 Segment Highlights
1.1.4 Regional and Country Analysis
1.1.5 Competitive Structure and Key M&A Activity
1.1.6 Principal Risks and Restraints
1.1.7 Outlook
2. Industry Overview & Forecast
2.1 Market Definition and Scope
2.2 Market Size and Historical Performance
2.3 Forecast and Growth Logic
2.4 Volume Analysis
2.5 Value-Chain Positioning and Pricing Dynamics
3. Market Segmentation by Type
3.1 Overview of the Type Segmentation Framework
3.2 Non-Aseptic Bag-in-box Packing Machines
3.2.1 Definition and Applications
3.2.2 Market Size, Share, and Forecast
3.2.3 Demand Drivers
3.2.4 Technology and Pricing Dynamics
3.2.5 Key Suppliers
3.2.6 Risks
3.3 Aseptic Bag-in-box Packing Machines
3.3.1 Definition and Applications
3.3.2 Market Size, Share, and Forecast
3.3.3 Demand Drivers
3.3.4 Technology and Pricing Dynamics
3.3.5 Key Suppliers
3.3.6 Risks
3.4 Volume Analysis
3.4.1 Year-by-Year Global Volume
3.4.2 Volume Trend Narrative
3.5 Comparative Analysis: Mix Shift and Strategic Implications
4. Market Segmentation by Application
4.1 Overview and Segment Architecture
4.1.1 Food and Beverages
4.1.1.1 Market Size and Growth Trajectory
4.1.1.2 Segment Definition and Product Scope
4.1.1.3 Buyer Behaviour and Procurement Patterns
4.1.1.4 Equipment Intensity and Production Economics
4.1.1.5 Growth Drivers
4.1.1.6 Segment Risks
4.1.2 Daily Chemicals
4.1.2.1 Market Size and Growth Trajectory
4.1.2.2 Segment Definition and Product Scope
4.1.2.3 Buyer Behaviour and Procurement Patterns
4.1.2.4 Equipment Intensity
4.1.2.5 Growth Drivers
4.1.2.6 Segment Risks
4.1.3 Industrial
4.1.3.1 Market Size and Growth Trajectory
4.1.3.2 Segment Definition and Product Scope
4.1.3.3 Buyer Behaviour and Procurement Patterns
4.1.3.4 Equipment Intensity
4.1.3.5 Growth Drivers
4.1.3.6 Segment Risks
4.1.4 Others
4.1.4.1 Market Size and Growth Trajectory
4.1.4.2 Segment Definition and Product Scope
4.1.4.3 Buyer Behaviour and Procurement Patterns
4.1.4.4 Equipment Intensity
4.1.4.5 Growth Drivers
4.1.4.6 Segment Risks
4.2 Comparative Assessment of Application Segments
5. Regional Market Forecast
5.1 North America
5.1.1 Regional Overview
5.1.2 Key Growth Drivers
5.1.3 Regulatory & Infrastructure Landscape
5.1.4 Country-Level Analysis
5.1.5 Market Forecast 2025–2031
5.2 Europe
5.2.1 Regional Overview
5.2.2 Key Growth Drivers
5.2.3 Regulatory & Infrastructure Landscape
5.2.4 Country-Level Analysis
5.2.5 Market Forecast 2025–2031
5.3 Asia Pacific
5.3.1 Regional Overview
5.3.2 Key Growth Drivers
5.3.3 Regulatory & Infrastructure Landscape
5.3.4 Country-Level Analysis
5.3.5 Market Forecast 2025–2031
5.4 Latin America
5.4.1 Regional Overview
5.4.2 Key Growth Drivers
5.4.3 Regulatory & Infrastructure Landscape
5.4.4 Country-Level Analysis
5.4.5 Market Forecast 2025–2031
5.5 Middle East and Africa
5.5.1 Regional Overview
5.5.2 Key Growth Drivers
5.5.3 Regulatory & Infrastructure Landscape
5.5.4 Country-Level Analysis
5.5.5 Market Forecast 2025–2031
6. Country-Level Market Forecast
6.1 North America
6.1.1 United States
6.1.2 Canada
6.1.3 Mexico
6.1.4 Rest of North America
6.2 Europe
6.2.1 Germany
6.2.2 Italy
6.2.3 France
6.2.4 United Kingdom
6.2.5 Russia
6.2.6 Rest of Europe
6.3 Asia Pacific
6.3.1 China
6.3.2 Japan
6.3.3 South Korea
6.3.4 India
6.3.5 Australia
6.3.6 Southeast Asia
6.3.7 Rest of Asia Pacific
6.4 Latin America
6.4.1 Brazil
6.4.2 Argentina
6.4.3 Chile
6.4.4 Colombia
6.4.5 Rest of Latin America
6.5 Middle East and Africa
6.5.1 GCC Countries
6.5.2 Turkey
6.5.3 Israel
6.5.4 South Africa
6.5.5 Egypt
6.5.6 Rest of Middle East and Africa
7. Growth Drivers & Inhibitors
7.1 Section Overview
7.2 Growth Drivers
7.2.1 Secular Expansion of Global Wine and Beverage Trade Driving Filler Demand
7.2.2 Accelerating Adoption of Aseptic Technology Opening a Premium Upgrade Cycle
7.2.3 Application Diversification Beyond Beverages Into Chemicals and Industrials
7.2.4 Emerging-Market Infrastructure Build-Out Generating Greenfield Filler Orders
7.2.5 Sustainability Mandates Accelerating Conversion From Rigid Packaging Formats
7.2.6 Automation and Smart-Line Integration Lifting Average Selling Prices
7.3 Market Inhibitors
7.3.1 High Capital Intensity of Automatic and Aseptic Machines Limiting Addressable Customer Base
7.3.2 Absence of Bag-Fitment Standardisation Creating Friction in Aftermarket and Expansion Decisions
7.3.3 Supplier Business Model Structurally Suppresses Disclosed Machine Revenue
7.3.4 Plastic-Film Recyclability Pressure Creating Investment Uncertainty Around Future Bag Formats
7.3.5 Competitive Pressure From Low-Cost Asian Manufacturers Compressing Entry-Level Pricing
7.4 Impact Assessment Summary
7.5 Integrated Assessment
8. Key Company Profiles
8.1 Smurfit Westrock
8.1.1 Company Overview
8.1.2 Key Products & Segments
8.1.3 Financial Performance (2023–2025)
8.1.4 Business Strategy
8.1.5 SWOT Analysis
8.1.6 Strategic Implications (2025–2031)
8.2 SIG (Scholle IPN)
8.2.1 Company Overview
8.2.2 Key Products & Segments
8.2.3 Financial Performance (2023–2025)
8.2.4 Business Strategy
8.2.5 SWOT Analysis
8.2.6 Strategic Implications (2025–2031)
8.3 Alfa Laval (Astepo)
8.3.1 Company Overview
8.3.2 Key Products & Segments
8.3.3 Financial Performance (2023–2025)
8.3.4 Business Strategy
8.3.5 SWOT Analysis
8.3.6 Strategic Implications (2025–2031)
8.4 Liquibox (Sealed Air)
8.4.1 Company Overview
8.4.2 Key Products & Segments
8.4.3 Financial Performance (2023–2025)
8.4.4 Business Strategy
8.4.5 SWOT Analysis
8.4.6 Strategic Implications (2025–2031)
8.5 Rapak (TriMas)
8.5.1 Company Overview
8.5.2 Key Products & Segments
8.5.3 Financial Performance (2023–2025)
8.5.4 Business Strategy
8.5.5 SWOT Analysis
8.5.6 Strategic Implications (2025–2031)
8.6 Technibag
8.6.1 Company Overview
8.6.2 Key Products & Segments
8.6.3 Financial Performance (2023–2025)
8.6.4 Business Strategy
8.6.5 SWOT Analysis
8.6.6 Strategic Implications (2025–2031)
8.7 FBR-Elpo S.p.A.
8.7.1 Company Overview
8.7.2 Key Products & Segments
8.7.3 Financial Performance (2023–2025)
8.7.4 Business Strategy
8.7.5 SWOT Analysis
8.7.6 Strategic Implications (2025–2031)
8.8 SBFT (Xi'an Shibo Fluid Technology)
8.8.1 Company Overview
8.8.2 Key Products & Segments
8.8.3 Financial Performance (2023–2025)
8.8.4 Business Strategy
8.8.5 SWOT Analysis
8.8.6 Strategic Implications (2025–2031)
9. Competitive Landscape
9.1.1 Competitive Landscape Overview
9.1.1.1 Market Structure and Number of Active Players
9.1.1.2 Concentration Metric
9.1.1.3 Profiled Suppliers: Verified Facts (No Share Estimates)
9.1.1.4 Regional Concentration Variations
9.1.1.5 Competitive Intensity Assessment
9.1.2 Competitive Intensity Assessment
9.1.2.1 Tier Structure (Qualitative)
9.1.2.2 Tier 1: Integrated Packaging Leaders
9.1.2.3 Tier 2: Specialist OEMs
9.1.2.4 Tier 3: Value and Regional Players
9.1.2.5 Capacity vs. Demand Dynamics
9.1.2.6 Pricing Environment
9.1.2.7 Barriers to Entry and Exit
9.1.3 Key Player Strategies & Positioning
9.1.3.1 Strategic Group Map Narrative
9.1.3.2 Differentiation Strategies Across Major Players
9.1.3.3 Geographic Strongholds
9.1.3.4 M&A and Partnership Activity, 2022–Present
9.1.3.5 R&D and Technology Investment Trends
9.1.4 Competitive Dynamics & Strategic Outlook
9.1.4.1 Overview of the Competitive Structure
9.1.4.2 Competitive Position by Region: Current Snapshot
9.1.4.3 Emerging Competitive Threats
9.1.4.4 Consolidation Versus Fragmentation Outlook: 2026–2031
9.1.4.5 Competitive Response Matrix
9.1.4.6 Strategic Recommendations for Market Participants, 2025–2031
9.1.4.7 Synthesis: Competitive Landscape at 2031
10. Porter's Five Forces Analysis
10.1 Threat of New Entrants
10.2 Bargaining Power of Buyers
10.3 Bargaining Power of Suppliers
10.4 Threat of Substitutes
10.5 Competitive Rivalry
11. PESTLE Analysis
11.1 Overview and Analytical Framework
11.2 Political
11.3 Economic
11.4 Sociological
11.5 Technological
11.6 Legal
11.7 Environmental
11.8 PESTLE Summary Table
12. SWOT Analysis
12.1 Industry SWOT Analysis
12.1.1 Detailed Analysis
12.1.1.1 Strengths
12.1.1.2 Weaknesses
12.1.1.3 Opportunities
12.1.1.4 Threats
12.1.2 Strategic Implications
13. Future Trends & Outlook
13.1 Trend Analysis
13.1.1 Aseptic Filling Technology Expansion
13.1.2 Premiumisation and Multi-Head Automation
13.1.3 Sustainability-Driven Demand for Bag-in-Box Solutions
13.1.4 Emerging-Market Infrastructure Build-Out
13.1.5 Consolidation of the Equipment Supply Chain Through M&A
13.1.6 Digitalisation, IIoT Integration and Remote Diagnostics
13.1.7 Wine and Beverage Sector Premiumisation Driving Higher-Specification Equipment
13.1.8 Low-Cost Asian Manufacturing Exerting Downward Price Pressure in Non-Aseptic Segment
13.2 Summary of Trend Assessment
13.3 Forward Outlook: 2026–2031
List of Exhibits
Exhibit 2.1: Forecast of Global Market YoY Growth Rate & CAGR Summary (in %)
Exhibit 2.2: Forecast of Global Market YoY Growth Rate & CAGR Summary (in %)
Exhibit 2.3: Forecast of Global (in USD Mn)
Exhibit 2.4: Forecast of North America (in USD Mn)
Exhibit 2.5: Forecast of Europe (in USD Mn)
Exhibit 2.6: Forecast of Asia Pacific (in USD Mn)
Exhibit 2.7: Forecast of Latin America (in USD Mn)
Exhibit 2.8: Forecast of Middle East and Africa (in USD Mn)
Exhibit 2.9: Forecast of Global (in Th. Machines)
Exhibit 2.10: Forecast of North America (in Th. Machines)
Exhibit 2.11: Forecast of Europe (in Th. Machines)
Exhibit 2.12: Forecast of Asia Pacific (in Th. Machines)
Exhibit 2.13: Forecast of Latin America (in Th. Machines)
Exhibit 2.14: Forecast of Middle East and Africa (in Th. Machines)
Exhibit 3.15: Forecast of Non-Aseptic Bag-in-box Packing Machines (in USD Mn)
Exhibit 3.16: Forecast of Aseptic Bag-in-box Packing Machines (in USD Mn)
Exhibit 3.17: Forecast of Non-Aseptic Bag-in-box Packing Machines (in Th. Machines)
Exhibit 3.18: Forecast of Aseptic Bag-in-box Packing Machines (in Th. Machines)
Exhibit 4.19: Forecast of Food and Beverages (in USD Mn)
Exhibit 4.20: Forecast of Food and Beverages (in Th. Machines)
Exhibit 4.21: Forecast of Daily Chemicals (in USD Mn)
Exhibit 4.22: Forecast of Daily Chemicals (in Th. Machines)
Exhibit 4.23: Forecast of Industrial (in USD Mn)
Exhibit 4.24: Forecast of Industrial (in Th. Machines)
Exhibit 4.25: Forecast of Others (in USD Mn)
Exhibit 4.26: Forecast of Others (in Th. Machines)
Exhibit 6.27: Forecast of North America (in USD Mn)
Exhibit 6.28: Forecast of United States (in USD Mn)
Exhibit 6.29: Forecast of Canada (in USD Mn)
Exhibit 6.30: Forecast of Mexico (in USD Mn)
Exhibit 6.31: Forecast of Rest of North America (in USD Mn)
Exhibit 6.32: Forecast of North America (in Th. Machines)
Exhibit 6.33: Forecast of United States (in Th. Machines)
Exhibit 6.34: Forecast of Canada (in Th. Machines)
Exhibit 6.35: Forecast of Mexico (in Th. Machines)
Exhibit 6.36: Forecast of Europe (in USD Mn)
Exhibit 6.37: Forecast of Germany (in USD Mn)
Exhibit 6.38: Forecast of Italy (in USD Mn)
Exhibit 6.39: Forecast of France (in USD Mn)
Exhibit 6.40: Forecast of United Kingdom (in USD Mn)
Exhibit 6.41: Forecast of Russia (in USD Mn)
Exhibit 6.42: Forecast of Rest of Europe (in USD Mn)
Exhibit 6.43: Forecast of Europe (in Th. Machines)
Exhibit 6.44: Forecast of Germany (in Th. Machines)
Exhibit 6.45: Forecast of Italy (in Th. Machines)
Exhibit 6.46: Forecast of France (in Th. Machines)
Exhibit 6.47: Forecast of United Kingdom (in Th. Machines)
Exhibit 6.48: Forecast of Russia (in Th. Machines)
Exhibit 6.49: Forecast of Rest of Europe (in Th. Machines)
Exhibit 6.50: Forecast of Asia Pacific (in USD Mn)
Exhibit 6.51: Forecast of China (in USD Mn)
Exhibit 6.52: Forecast of Japan (in USD Mn)
Exhibit 6.53: Forecast of South Korea (in USD Mn)
Exhibit 6.54: Forecast of India (in USD Mn)
Exhibit 6.55: Forecast of Australia (in USD Mn)
Exhibit 6.56: Forecast of Southeast Asia (in USD Mn)
Exhibit 6.57: Forecast of Rest of Asia Pacific (in USD Mn)
Exhibit 6.58: Forecast of Asia Pacific (in Th. Machines)
Exhibit 6.59: Forecast of China (in Th. Machines)
Exhibit 6.60: Forecast of Japan (in Th. Machines)
Exhibit 6.61: Forecast of South Korea (in Th. Machines)
Exhibit 6.62: Forecast of India (in Th. Machines)
Exhibit 6.63: Forecast of Australia (in Th. Machines)
Exhibit 6.64: Forecast of Southeast Asia (in Th. Machines)
Exhibit 6.65: Forecast of Rest of Asia Pacific (in Th. Machines)
Exhibit 6.66: Forecast of Latin America (in USD Mn)
Exhibit 6.67: Forecast of Brazil (in USD Mn)
Exhibit 6.68: Forecast of Argentina (in USD Mn)
Exhibit 6.69: Forecast of Chile (in USD Mn)
Exhibit 6.70: Forecast of Colombia (in USD Mn)
Exhibit 6.71: Forecast of Rest of Latin America (in USD Mn)
Exhibit 6.72: Forecast of Latin America (in Th. Machines)
Exhibit 6.73: Forecast of Brazil (in Th. Machines)
Exhibit 6.74: Forecast of Argentina (in Th. Machines)
Exhibit 6.75: Forecast of Chile (in Th. Machines)
Exhibit 6.76: Forecast of Rest of Latin America (in Th. Machines)
Exhibit 6.77: Forecast of Middle East and Africa (in USD Mn)
Exhibit 6.78: Forecast of GCC Countries (in USD Mn)
Exhibit 6.79: Forecast of Turkey (in USD Mn)
Exhibit 6.80: Forecast of Israel (in USD Mn)
Exhibit 6.81: Forecast of South Africa (in USD Mn)
Exhibit 6.82: Forecast of Egypt (in USD Mn)
Exhibit 6.83: Forecast of Rest of Middle East and Africa (in USD Mn)
Exhibit 6.84: Forecast of Middle East and Africa (in Th. Machines)
Exhibit 6.85: Forecast of GCC Countries (in Th. Machines)
Exhibit 6.86: Forecast of Turkey (in Th. Machines)
Exhibit 6.87: Forecast of South Africa (in Th. Machines)
Exhibit 6.88: Forecast of Rest of Middle East and Africa (in Th. Machines)
*If Applicable.

NAVADHI is a market research company that helps global firms differentiate themselves, break market entry barriers, track their investments, develop business strategies and plan for future by providing actionable market research intelligence that helps them succeed.