
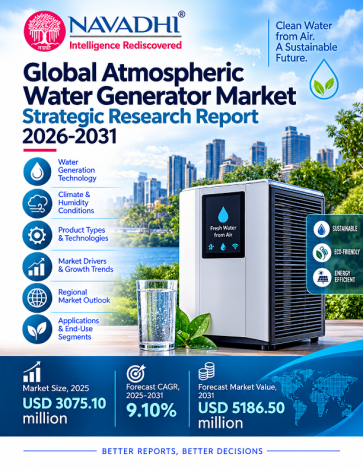

The global atmospheric water generator (AWG) market is estimated at US$3,075.1 million in 2025 and is forecast to reach US$5,186.5 million by 2031, a compound annual growth rate (CAGR) of 9.1% over 2025-2031. Mechanical cooling condensation is the largest of five technology types at US$1,845.0 million (60.0% share) in 2025, followed by wet desiccant systems (18.0%), hybrid solar and other systems (10.0%) and thermoelectric cooling condensation (7.0%). Hybrid solar and other systems is the fastest-growing type at 12.3% CAGR and thermoelectric cooling condensation the slowest at 6.7%. Asia Pacific is the largest region at 36.7% of 2025 value, followed by North America at 23.3% and the Middle East and Africa at 20.8%; the Middle East and Africa grows fastest at 9.4% CAGR.
The report measures equipment sales of atmospheric water generators at current prices in US dollars. Value is carried only: no source publishes units shipped or installed capacity, so no volume forecast is included. The total is anchored to the median of six published 2025 market estimates (US$2.8 to 4.4 billion), and the technology, regional, application and country splits are Navadhi estimates shown with their evidence grade. No profiled company discloses atmospheric water generator revenue, so no company market shares are given.
Scope of the Global Atmospheric Water Generator Market Strategic Research Report
This report covers market value (US$ million) for 2022-2031, with 2025 as the base year and 2026-2031 as the forecast period. It analyses five technology types, six applications, five regions and 22 named country markets (plus rest-of-region groups), including a South Africa market sized at US$25.6 million in 2025 (an estimate), and profiles 18 companies including five South African suppliers.
Segment by Type
Segment by Application
Key Companies Profiled
Water-Gen Ltd. (Watergen), SOURCE Global PBC, Akvo Atmospheric Water Systems Pvt. Ltd., GENAQ Technologies S.L., EcoloBlue Inc., Dew Point Manufacturing, SkyWater Air Water Machines, Drinkable Air Technologies, Water Technologies International Inc., WaterMaker India Pvt. Ltd., A1R WATER, Kumulus Water, WaHa Inc., SkyTap, Hout Bay Air Water Pty Ltd (Air Water), DewTech, Aqua Air Africa (Moipone Group Investments), Cirrus Water Management.
1. Executive Summary
1.1 Market Definition and Size
1.2 Principal Growth Drivers
1.3 Segment Highlights
1.4 Regional and Country Highlights
1.5 Competitive Structure and Key M&A Activity
1.6 Principal Risks
1.7 Outlook
2. Industry Overview & Forecast
2.1 Market Definition and Scope
2.2 Market Size and Historical Performance
2.3 Forecast and Growth Logic
2.4 Volume Analysis
2.5 Value-Chain and Pricing Dimensions
3. Market Segmentation by Type
3.1 Overview of the Type Landscape
3.1.1 Mechanical Cooling Condensation
3.1.2 Thermoelectric Cooling Condensation
3.1.3 Wet Desiccant Systems
3.1.4 Solid Sorbent and Hydropanel Systems
3.1.5 Hybrid Solar and Other Systems
3.2 Comparative Analysis: Technology Mix Shift Through 2031
4. Market Segmentation by Application
4.1 Overview of the Application Landscape
4.1.1 Residential
4.1.2 Commercial and Hospitality
4.1.3 Industrial
4.1.4 Healthcare and Food and Beverage
4.1.5 Defense and Disaster Relief
4.1.6 Agriculture and Community Water
4.2 Comparative Assessment Across Application Segments
5. Regional Market Forecast
5.1 North America
5.1.1 Regional Overview
5.1.2 Key Growth Drivers
5.1.3 Regulatory & Infrastructure Landscape
5.1.4 Country-Level Analysis
5.1.5 Market Forecast 2025–2031
5.2 Europe
5.2.1 Regional Overview
5.2.2 Key Growth Drivers
5.2.3 Regulatory & Infrastructure Landscape
5.2.4 Country-Level Analysis
5.2.5 Market Forecast 2025–2031
5.3 Asia Pacific
5.3.1 Regional Overview
5.3.2 Key Growth Drivers
5.3.3 Regulatory & Infrastructure Landscape
5.3.4 Country-Level Analysis
5.3.5 Market Forecast 2025–2031
5.4 Latin America
5.4.1 Regional Overview
5.4.2 Key Growth Drivers
5.4.3 Regulatory & Infrastructure Landscape
5.4.4 Country-Level Analysis
5.4.5 Market Forecast 2025–2031
5.5 Middle East and Africa
5.5.1 Regional Overview
5.5.2 Key Growth Drivers
5.5.3 Regulatory & Infrastructure Landscape
5.5.4 Country-Level Analysis
5.5.5 Market Forecast 2025–2031
6. Country-Level Market Forecast
6.1 North America
6.1.1 United States
6.1.2 Canada
6.1.3 Rest of North America
6.2 Europe
6.2.1 Germany
6.2.2 United Kingdom
6.2.3 France
6.2.4 Spain
6.2.5 Italy
6.2.6 Netherlands
6.2.7 Rest of Europe
6.3 Asia Pacific
6.3.1 China
6.3.2 India
6.3.3 Japan
6.3.4 Australia
6.3.5 South Korea
6.3.6 Indonesia
6.3.7 Rest of Asia Pacific
6.4 Latin America
6.4.1 Brazil
6.4.2 Mexico
6.4.3 Chile
6.4.4 Rest of Latin America
6.5 Middle East and Africa
6.5.1 United Arab Emirates
6.5.2 Saudi Arabia
6.5.3 Israel
6.5.4 South Africa
6.5.5 Egypt
6.5.6 Rest of Middle East and Africa
7. Growth Drivers & Inhibitors
7.1 Section Overview
7.2 Growth Drivers
7.3 Inhibitors
7.4 Driver and Inhibitor Impact Assessment
7.5 Integrated Assessment
8. Key Company Profiles
8.1 Water-Gen Ltd. (Watergen)
8.1.1 Company Overview
8.1.2 Key Products & Segments
8.1.3 Financial Performance (2023–2025)
8.1.4 Business Strategy
8.1.5 SWOT Analysis
8.1.6 Strategic Implications (2025–2031)
8.2 SOURCE Global PBC
8.2.1 Company Overview
8.2.2 Key Products & Segments
8.2.3 Financial Performance (2023–2025)
8.2.4 Business Strategy
8.2.5 SWOT Analysis
8.2.6 Strategic Implications (2025–2031)
8.3 Akvo Atmospheric Water Systems Pvt. Ltd.
8.3.1 Company Overview
8.3.2 Key Products & Segments
8.3.3 Financial Performance (2023–2025)
8.3.4 Business Strategy
8.3.5 SWOT Analysis
8.3.6 Strategic Implications (2025–2031)
8.4 GENAQ Technologies S.L.
8.4.1 Company Overview
8.4.2 Key Products & Segments
8.4.3 Financial Performance (2023–2025)
8.4.4 Business Strategy
8.4.5 SWOT Analysis
8.4.6 Strategic Implications (2025–2031)
8.5 EcoloBlue Inc.
8.5.1 Company Overview
8.5.2 Key Products & Segments
8.5.3 Financial Performance (2023–2025)
8.5.4 Business Strategy
8.5.5 SWOT Analysis
8.5.6 Strategic Implications (2025–2031)
8.6 Dew Point Manufacturing
8.6.1 Company Overview
8.6.2 Key Products & Segments
8.6.3 Financial Performance (2023–2025)
8.6.4 Business Strategy
8.6.5 SWOT Analysis
8.6.6 Strategic Implications (2025–2031)
8.7 SkyWater Air Water Machines
8.7.1 Company Overview
8.7.2 Key Products & Segments
8.7.3 Financial Performance (2023–2025)
8.7.4 Business Strategy
8.7.5 SWOT Analysis
8.7.6 Strategic Implications (2025–2031)
8.8 Drinkable Air Technologies
8.8.1 Company Overview
8.8.2 Key Products & Segments
8.8.3 Financial Performance (2023–2025)
8.8.4 Business Strategy
8.8.5 SWOT Analysis
8.8.6 Strategic Implications (2025–2031)
8.9 Water Technologies International Inc.
8.9.1 Company Overview
8.9.2 Key Products & Segments
8.9.3 Financial Performance (2023–2025)
8.9.4 Business Strategy
8.9.5 SWOT Analysis
8.9.6 Strategic Implications (2025–2031)
8.10 WaterMaker India Pvt. Ltd.
8.10.1 Company Overview
8.10.2 Key Products & Segments
8.10.3 Financial Performance (2023–2025)
8.10.4 Business Strategy
8.10.5 SWOT Analysis
8.10.6 Strategic Implications (2025–2031)
8.11 A1R WATER
8.11.1 Company Overview
8.11.2 Key Products & Segments
8.11.3 Financial Performance (2023–2025)
8.11.4 Business Strategy
8.11.5 SWOT Analysis
8.11.6 Strategic Implications (2025–2031)
8.12 Kumulus Water
8.12.1 Company Overview
8.12.2 Key Products & Segments
8.12.3 Financial Performance (2023–2025)
8.12.4 Business Strategy
8.12.5 SWOT Analysis
8.12.6 Strategic Implications (2025–2031)
8.13 WaHa Inc.
8.13.1 Company Overview
8.13.2 Key Products & Segments
8.13.3 Financial Performance (2023–2025)
8.13.4 Business Strategy
8.13.5 SWOT Analysis
8.13.6 Strategic Implications (2025–2031)
8.14 SkyTap
8.14.1 Company Overview
8.14.2 Key Products & Segments
8.14.3 Financial Performance (2023–2025)
8.14.4 Business Strategy
8.14.5 SWOT Analysis
8.14.6 Strategic Implications (2025–2031)
8.15 Hout Bay Air Water Pty Ltd (Air Water)
8.15.1 Company Overview
8.15.2 Key Products & Segments
8.15.3 Financial Performance (2023–2025)
8.15.4 Business Strategy
8.15.5 SWOT Analysis
8.15.6 Strategic Implications (2025–2031)
8.16 DewTech
8.16.1 Company Overview
8.16.2 Key Products & Segments
8.16.3 Financial Performance (2023–2025)
8.16.4 Business Strategy
8.16.5 SWOT Analysis
8.16.6 Strategic Implications (2025–2031)
8.17 Aqua Air Africa (Moipone Group Investments)
8.17.1 Company Overview
8.17.2 Key Products & Segments
8.17.3 Financial Performance (2023–2025)
8.17.4 Business Strategy
8.17.5 SWOT Analysis
8.17.6 Strategic Implications (2025–2031)
8.18 Cirrus Water Management
8.18.1 Company Overview
8.18.2 Key Products & Segments
8.18.3 Financial Performance (2023–2025)
8.18.4 Business Strategy
8.18.5 SWOT Analysis
8.18.6 Strategic Implications (2025–2031)
9. Competitive Landscape
9.1 Competitive Landscape Overview
9.1.1 Market Structure and the Nature of Competition
9.1.2 Company Reference Table
9.1.3 Why Concentration Cannot Be Measured
9.1.4 Technology Segmentation as a Structural Lens
9.1.5 Competitive Differentiation: Capital, Geography, and M&A
9.1.6 South African Sub-Market as a Competitive Microcosm
9.1.7 Overall Competitive Intensity Assessment
9.2 Competitive Intensity Assessment
9.2.1 Market Structure and Company Groupings
9.2.2 Capacity Versus Demand Dynamics
9.2.3 Pricing Environment
9.2.4 Barriers to Entry and Exit
9.3 Key Player Strategies & Positioning
9.3.1 Strategic Group Narrative
9.3.2 Key Profiled Company Strategic Summary
9.3.3 M&A and Partnership Activity, 2022–Present
9.3.4 R&D and Technology Investment Trends
9.4 Competitive Dynamics & Strategic Outlook
9.4.1 Market Structure: A Fragmented, Predominantly Private Landscape
9.4.2 Emerging Competitive Threats
9.4.3 The SOURCE Global Warning
9.4.4 Consolidation vs. Fragmentation Outlook
9.4.5 Competitive Response Matrix
9.4.6 Strategic Recommendations for 2026–2031
10. Porter's Five Forces Analysis
10.1 Threat of New Entrants
10.2 Bargaining Power of Buyers
10.3 Bargaining Power of Suppliers
10.4 Threat of Substitutes
10.5 Competitive Rivalry
11. PESTLE Analysis
11.1 Overview
11.2 Political
11.3 Economic
11.4 Sociological
11.5 Technological
11.6 Legal
11.7 Environmental
11.8 PESTLE Summary Assessment
12. SWOT Analysis
12.1 Global Atmospheric Water Generator Market — Strategic Position Assessment
12.1.1 Detailed Analysis
12.1.1.1 Strengths
12.1.1.2 Weaknesses
12.1.1.3 Opportunities
12.1.1.4 Threats
12.1.2 Strategic Implications and Priority Actions
13. Future Trends & Outlook
13.1 Trend Assessment Framework
13.2 Trend
13.3 Trend: Technological Bifurcation Between Scale and Portability
13.4 Trend: Energy Efficiency Becoming a Primary Procurement Criterion
13.5 Trend
13.6 Trend: Geographic Expansion Through Partnership Architecture
13.7 Trend: Residential and Sub-100-Litre Market Segment Deepening
13.8 Trend
13.9 Trend
13.10 Summary Table: Future Trends Assessment
13.11 Forward Outlook: 2026–2031
List of Exhibits
Exhibit 2.1: Forecast of Global Market YoY Growth Rate & CAGR Summary (in %)
Exhibit 2.2: Forecast of Global (in USD Bn)
Exhibit 2.3: Forecast of North America (in USD Bn)
Exhibit 2.4: Forecast of Europe (in USD Bn)
Exhibit 2.5: Forecast of Asia Pacific (in USD Bn)
Exhibit 2.6: Forecast of Latin America (in USD Bn)
Exhibit 2.7: Forecast of Middle East and Africa (in USD Bn)
Exhibit 3.8: Forecast of Mechanical Cooling Condensation (in USD Bn)
Exhibit 3.9: Forecast of Thermoelectric Cooling Condensation (in USD Bn)
Exhibit 3.10: Forecast of Wet Desiccant Systems (in USD Bn)
Exhibit 3.11: Forecast of Solid Sorbent and Hydropanel Systems (in USD Bn)
Exhibit 3.12: Forecast of Hybrid Solar and Other Systems (in USD Bn)
Exhibit 4.13: Forecast of Residential (in USD Bn)
Exhibit 4.14: Forecast of Commercial and Hospitality (in USD Bn)
Exhibit 4.15: Forecast of Industrial (in USD Bn)
Exhibit 4.16: Forecast of Healthcare and Food and Beverage (in USD Bn)
Exhibit 4.17: Forecast of Defense and Disaster Relief (in USD Bn)
Exhibit 4.18: Forecast of Agriculture and Community Water (in USD Bn)
Exhibit 6.19: Forecast of North America (in USD Bn)
Exhibit 6.20: Forecast of United States (in USD Bn)
Exhibit 6.21: Forecast of Canada (in USD Bn)
Exhibit 6.22: Forecast of Rest of North America (in USD Bn)
Exhibit 6.23: Forecast of Europe (in USD Bn)
Exhibit 6.24: Forecast of Germany (in USD Bn)
Exhibit 6.25: Forecast of United Kingdom (in USD Bn)
Exhibit 6.26: Forecast of France (in USD Bn)
Exhibit 6.27: Forecast of Spain (in USD Bn)
Exhibit 6.28: Forecast of Italy (in USD Bn)
Exhibit 6.29: Forecast of Netherlands (in USD Bn)
Exhibit 6.30: Forecast of Rest of Europe (in USD Bn)
Exhibit 6.31: Forecast of Asia Pacific (in USD Bn)
Exhibit 6.32: Forecast of China (in USD Bn)
Exhibit 6.33: Forecast of India (in USD Bn)
Exhibit 6.34: Forecast of Japan (in USD Bn)
Exhibit 6.35: Forecast of Australia (in USD Bn)
Exhibit 6.36: Forecast of South Korea (in USD Bn)
Exhibit 6.37: Forecast of Indonesia (in USD Bn)
Exhibit 6.38: Forecast of Rest of Asia Pacific (in USD Bn)
Exhibit 6.39: Forecast of Latin America (in USD Bn)
Exhibit 6.40: Forecast of Brazil (in USD Bn)
Exhibit 6.41: Forecast of Mexico (in USD Bn)
Exhibit 6.42: Forecast of Chile (in USD Bn)
Exhibit 6.43: Forecast of Rest of Latin America (in USD Bn)
Exhibit 6.44: Forecast of Middle East and Africa (in USD Bn)
Exhibit 6.45: Forecast of United Arab Emirates (in USD Bn)
Exhibit 6.46: Forecast of Saudi Arabia (in USD Bn)
Exhibit 6.47: Forecast of Israel (in USD Bn)
Exhibit 6.48: Forecast of South Africa (in USD Bn)
Exhibit 6.49: Forecast of Egypt (in USD Bn)
Exhibit 6.50: Forecast of Rest of Middle East and Africa (in USD Bn)
*If Applicable.

NAVADHI is a market research company that helps global firms differentiate themselves, break market entry barriers, track their investments, develop business strategies and plan for future by providing actionable market research intelligence that helps them succeed.